Worksheet: Data Handling

Q1. Grade 8 students recorded the colours of cars that drove by their school over a five minute period. Each car picture = 1 car. 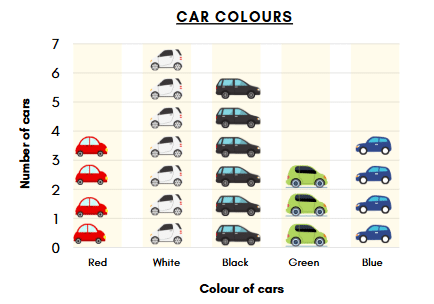
Complete the following questions:
a) What colour car was the most popular?
b) What colour car was recorded six (6) times?
c) What is the total number of red and white cars recorded?
Q2. In a class, children were asked about their favourite fruits. Each fruit symbol in the chart below represents one child's choice. The chart shows how many children liked each type of fruit - bananas, apples, oranges, avocados, and pears.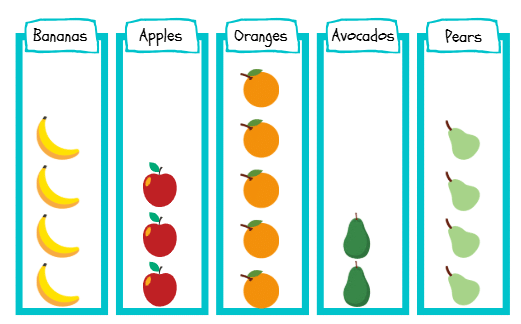
a) How many children like pear?
b) Which fruit do children like the most?
c) Which fruit do children like the least?
Q3. The bar graph shows how many students liked different school subjects: Math, Science, Sport, History, and STEM (Science, Technology, Engineering, and Math). Each bar's height tells us the number of students who liked that subject.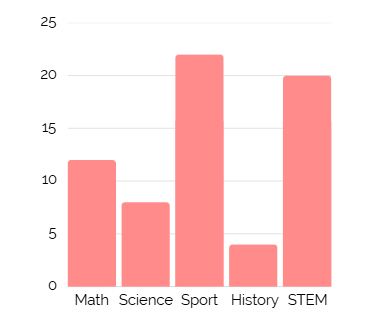
a) How many liked STEM?
b) What was the least preferred subject?
c) How many students were surveyed altogether?
Q4. The following pictograph shows the number of pet animals sold in a month -
Each symbol = 5 pets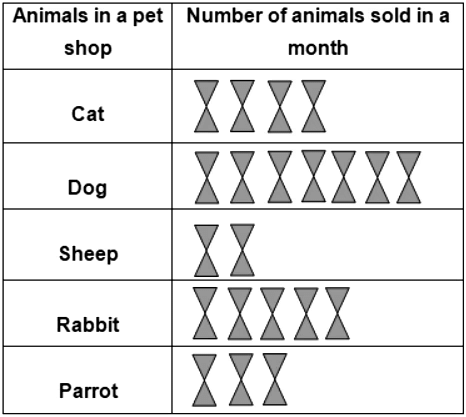
(i) How many more Cats were sold as compared to Sheep ?
(a) 25
(b) 10
(c) 20
(ii) How many Parrots were sold in a month?
(a) 16
(b) 15
(c) 10
(iii) Which pet was sold the most ?
(a) Parrot
(b) Rabbit
(c) Dog
(iv) How many Dogs were sold in a month ?
(a) 35
(b) 55
(c) 30
(v) Which pet was sold the least ?
(a) Dog
(b) Cat
(c) Sheep
Q5. The total number of animals in five villages are given below: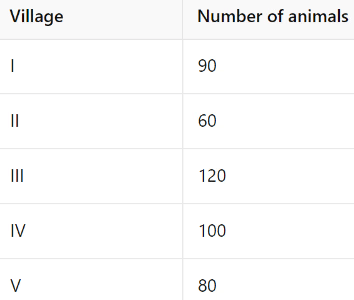
Draw a pictograph to represent the above data.
You can see the solutions of worksheet here.
FAQs on Worksheet: Data Handling
| 1. What is data handling in Class 4? |  |
| 2. Why is data handling important for students? | |
| 3. What types of data representations are taught in Class 4? | |
| 4. How can students practice data handling skills at home? | |
| 5. What activities can teachers use to teach data handling effectively? | |