The Language of Variation: Variables Chapter Notes | AP Statistics - Grade 9 PDF Download

Types of Variables
Variables are characteristics that vary across individuals or units, and they fall into two main categories:
- Categorical Variables: These represent qualities or attributes that can be grouped into categories, not numbers. Examples include car colors (e.g., red, blue, black), state names, or countries. Categorical data is often grouped for comparison.
- Quantitative Variables: These involve numerical measurements, such as the number of days, product prices, or ages. Quantitative data can be further divided into:
- Discrete: Whole numbers, like the number of children in a family.
- Continuous: Values within a range, like height, weight, or age, which can include decimals.
Quantitative data allows for calculations like averages, while categorical data is used for grouping and comparison.
Levels of Measurement
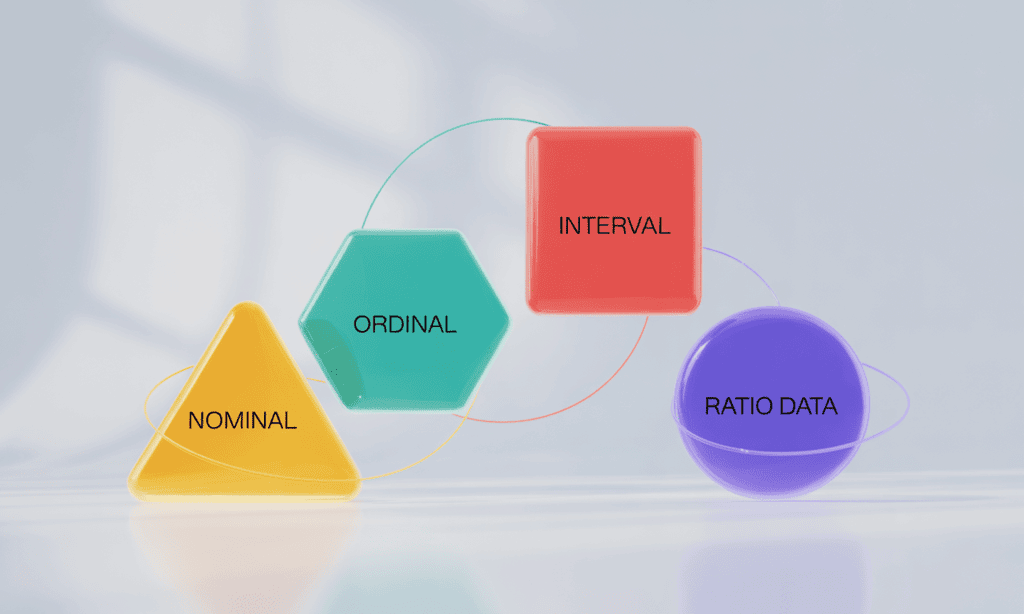
Variables are measured at different levels, which determine how they can be analyzed:
- Nominal: Categorical data with no inherent order, e.g., eye color or gender.
- Ordinal: Categorical data with a meaningful order but no consistent differences between ranks, e.g., customer satisfaction (low, medium, high).
- Interval: Quantitative data with equal intervals but no true zero, e.g., temperature in Celsius.
- Ratio: Quantitative data with equal intervals and a true zero, allowing ratios like "twice as much," e.g., weight or income.
Why Variability Matters
Variables differ across individuals and over time, creating variability that makes statistics fascinating. By studying these differences, we can uncover patterns and relationships using statistical tools, which we’ll explore further in Units 6–9 of the AP Statistics course.
Categorical vs. Quantitative Variables: A Deeper Look
Let’s clarify the distinction between categorical and quantitative variables:
- Categorical Variables: Represent non-numerical categories, such as gender (male, female), race, or marital status (single, married). These cannot be ranked or quantified numerically.
- Quantitative Variables: Represent numerical values, either:
- Continuous: Any value within a range, e.g., height (5.7 ft) or weight (150.2 lbs).
- Discrete: Specific numerical values, e.g., number of siblings (1, 2, 3).
Identifying variable types is crucial because different statistical methods apply to each. For instance, chi-square tests analyze categorical data, while t-tests are used for continuous quantitative data (more on these in later units).
Examples of Categorical Variables
- Gender (male, female)
- Race (e.g., White, Black, Hispanic)
- Marital status (single, married, divorced)
- Employment status (employed, unemployed, self-employed)
- Education level (high school, bachelor’s degree, etc.)
- Political party (Republican, Democrat, Independent)
- Religion (Christian, Muslim, Hindu)
- Eye color (blue, brown, green)
- Hair color (blonde, brunette, red)
- Birthplace (United States, Canada, Mexico)
Examples of Quantitative Variables
- Age (e.g., 16, 34)
- Height (e.g., 5’2”, 180 cm)
- Weight
- Income
- Body mass index (BMI)
- Blood pressure
- Heart rate
- Hours of sleep
- Distance traveled
- Number of siblings
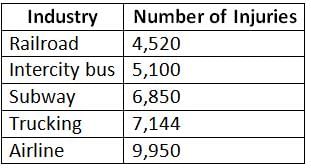
Example: Transportation Safety (1998 Data)
The following table shows job-related injuries in transportation industries in 1998:
- What are the variables studied?
The variables are the type of industry (e.g., railroad, airline) and the number of job-related injuries. - Are they quantitative or categorical?
The type of industry is categorical (names of industries), and the number of injuries is quantitative (numerical values). - Is the quantitative variable discrete or continuous?
The number of injuries is discrete, as it represents whole numbers. - What is the level of measurement for each variable?
Industry type is nominal (no order), and the number of injuries is ratio (has a true zero). - Does the railroad’s low injury count mean it’s the safest?
Railroads have the fewest injuries (4,520), but safety conclusions require context, such as the number of employees in each industry. - What’s the relationship between the variables?
Railroads have the lowest injuries, while airlines have the highest (9,950, over twice that of railroads). Subway and trucking industries have similar injury counts (6,850 and 7,144).
Takeaway: Always look beyond the numbers to understand relationships and context in data.
- Categorical Variable: Represents groups or categories without numerical values, used for classifying data.
- Chi-Square Test: A statistical test to assess relationships between categorical variables or compare observed and expected distributions.
- Continuous: A variable that can take any value within a range, e.g., height or temperature.
- Interval Level: Quantitative scale with equal intervals but no true zero, e.g., Celsius temperature.
- Nominal Level: Categorical data with no order, e.g., colors or names.
- Ordinal Level: Categorical data with a meaningful order but no consistent intervals, e.g., rankings.
- Ratio Level: Quantitative scale with a true zero, allowing ratios, e.g., weight or income.
- T-test: A statistical test to compare means of two groups or assess regression slopes, used for quantitative data.
|
12 videos|106 docs|12 tests
|
FAQs on The Language of Variation: Variables Chapter Notes - AP Statistics - Grade 9
| 1. What are categorical variables and how do they differ from quantitative variables? |  |
| 2. Can you provide examples of categorical and quantitative variables? | |
| 3. What is the significance of understanding the difference between categorical and quantitative variables in data analysis? | |
| 4. How are ordinal variables classified, and how do they relate to categorical variables? | |
| 5. What statistical tests are suitable for analyzing categorical versus quantitative variables? | |


video lectures
,Objective type Questions
,past year papers
,The Language of Variation: Variables Chapter Notes | AP Statistics - Grade 9
,Sample Paper
,study material
,Viva Questions
,practice quizzes
,shortcuts and tricks
,Previous Year Questions with Solutions
,The Language of Variation: Variables Chapter Notes | AP Statistics - Grade 9
,The Language of Variation: Variables Chapter Notes | AP Statistics - Grade 9
,Important questions
,mock tests for examination
,Exam
,Free
,Summary
,MCQs
,ppt
,Semester Notes
,Extra Questions
;


Chapter Notes: The Language of Variation: Variables Free PDF Download
Importance of Chapter Notes: The Language of Variation: Variables
Chapter Notes: The Language of Variation: Variables
Chapter Notes: The Language of Variation: Variables Grade 9 Questions
Study Chapter Notes: The Language of Variation: Variables on the App
|
© EduRev
|
Education Revolution
|


|


within 7 days!