Grade 9 Exam > Grade 9 Notes > AP Statistics > Chapter Notes: Overview: Exploring Two-Variable Data
Overview: Exploring Two-Variable Data Chapter Notes | AP Statistics - Grade 9 PDF Download

Welcome to Unit 2 of AP Statistics! This unit dives into the analysis of relationships between two variables, helping you understand how to visualize, describe, and interpret data connections using tools like scatterplots, correlation, and regression models. Let’s break it down into manageable pieces with examples to guide you!
What You’ll Learn
- Scatterplots: Create and analyze scatterplots to spot patterns and trends in two-variable data.
- Correlation: Understand the correlation coefficient, which quantifies the strength and direction of a linear relationship between two variables.
- Least-Squares Regression: Learn to find the best-fit line for data and use it to predict outcomes.
- Interpreting Regression Lines: Decode the slope and y-intercept of a regression line to understand variable relationships and make predictions.
- Evaluating Linear Models: Assess how well a linear model fits the data.
- Residual Plots: Use residual plots to determine if a linear model is appropriate for describing data relationships.
Don’t worry if this feels overwhelming—this unit is broken into bite-sized sections with plenty of examples to make it clear!
Exam Weighting
- Accounts for 5–7% of the AP Statistics exam.
- Expect 2–3 multiple-choice questions.
- May include one Free Response Question (FRQ) or part of an investigative task.
Bivariate Data: Categorical vs. Quantitative
After mastering single-variable statistics, Unit 2 steps up to bivariate data, which involves two variables. These can be either categorical or quantitative, each requiring different analysis methods.
Categorical Data
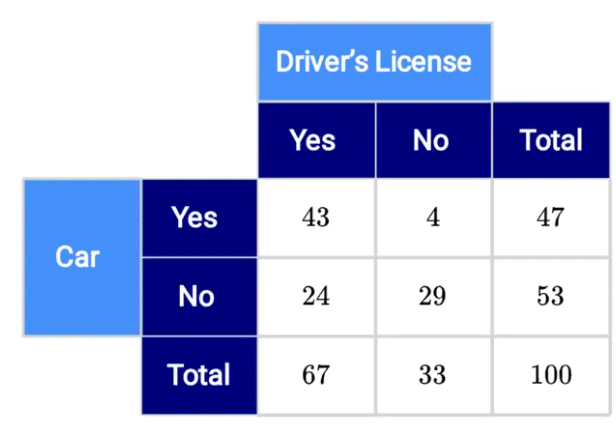
Categorical bivariate data is analyzed using two-way tables to explore relationships between two categorical variables. For example, you might examine a dataset comparing students’ class levels (e.g., freshman, sophomore) with their preferred learning mode (virtual or in-person) for the 2020–2021 school year. This setup helps statisticians identify potential correlations between the variables.
Quantitative Data
Quantitative bivariate data is visualized using scatterplots, with one variable (independent) plotted on the x-axis and the other (dependent) on the y-axis. For instance, plotting height (x-axis) against shoe size (y-axis) might reveal a positive correlation, where taller individuals tend to have larger shoe sizes. Linear regression models are often used to fit a line to the scatterplot, enabling predictions within the data range.
Computer Outputs
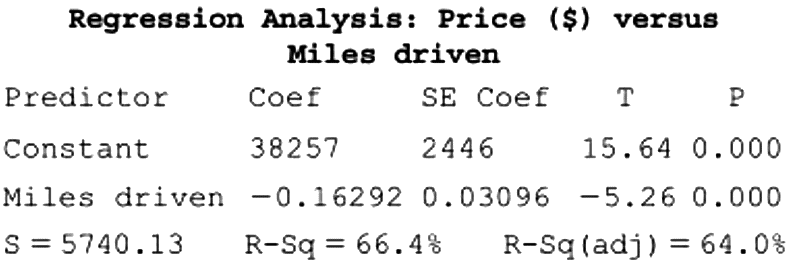
Rather than creating scatterplots or regression models from scratch, the AP exam typically provides computer-generated outputs (e.g., scatterplots, two-way tables, or regression models) for interpretation. Your key skill is understanding and explaining these outputs in context, including elements like slope, y-intercept, correlation coefficient, and coefficient of determination for regression models, or joint, marginal, and conditional relative frequencies for categorical data.
Mathematical Practices
This unit incorporates three College Board mathematical practices:
- Selecting Statistical Methods: Choose appropriate methods for analyzing two-variable data, distinguishing between categorical and quantitative approaches.
- Data Analysis: Calculate statistics, create models, and draw conclusions from bivariate datasets.
- Statistical Argumentation: Build arguments about variable relationships, remembering that correlation does not imply causation. For example, if rainfall is higher on Tuesdays than Mondays, it doesn’t mean the day of the week causes more rain—correlation exists, but not causation.
Main Concepts
- Categorical Variables: Two-way tables, joint/marginal/conditional relative frequencies, side-by-side bar graphs, segmented bar graphs, mosaic plots.
- Quantitative Variables: Scatterplots (form, direction, strength, unusual features like gaps, clusters, outliers), correlation coefficient, linear regression, residuals, r, R², s, extrapolation, influential points, data transformations.
Question for Chapter Notes: Overview: Exploring Two-Variable DataTry yourself: What type of data is analyzed using two-way tables?View Solution
Key Terms to Know
- Bivariate Data: Data involving two variables, used to study their relationship and identify patterns or trends.
- Categorical Variables: Non-numerical data representing categories, like gender or class level, used for grouping and comparison.
- Categorical Data Methods: Techniques for analyzing categorical data, focusing on relationships and patterns within groups.
- Conditional Relative Frequencies: Proportions of outcomes within a specific subgroup, revealing relationships between categorical variables.
- Correlation Coefficient: A value (-1 to 1) measuring the strength and direction of a linear relationship between two quantitative variables.
- Correlation Does Not Imply Causation: A reminder that a relationship between variables doesn’t mean one causes the other.
- Data Analysis: Applying statistical techniques to summarize, interpret, and draw conclusions from data.
- Extrapolation: Predicting values beyond the observed data range, often less reliable than interpolation.
- Intercept: The y-axis point where a regression line crosses, representing the dependent variable’s value when the independent variable is zero.
- Linear Regression Models: Methods to predict a dependent variable using one or more independent variables via a linear equation.
- Least-Squares Regression: A linear regression method that minimizes the sum of squared residuals to find the best-fit line.
- Marginal Relative Frequencies: Proportions of a category relative to the total dataset in a contingency table.
- Mosaic Plots: Visuals showing relationships between two categorical variables using proportional rectangles.
- Quantitative Data Methods: Techniques for analyzing numerical data to identify patterns and make predictions.
- Quantitative Variables: Measurable data expressed numerically, suitable for calculations and regressions.
- R, R², and s: r (correlation coefficient), R² (proportion of variance explained), s (standard deviation of residuals).
- Regression Equation: A formula describing the relationship between dependent and independent variables for predictions.
- Residuals: Differences between observed and predicted values, used to assess a regression model’s fit.
- Scatterplots: Graphs plotting two quantitative variables to visualize their relationship and trends.
- Segmented Bar Graphs: Bar graphs divided into segments to show categorical data proportions within a group.
- Side-by-Side Bar Graphs: Bar graphs comparing categorical variables side by side to highlight differences.
- Slope: The rate of change in a regression line, showing how the dependent variable changes per unit of the independent variable.
- Statistical Argumentation: Using data to support or refute claims, emphasizing contextual interpretation.
- Strength: The degree of correlation between variables, indicating how well one predicts the other.
- Two-Variable Statistics Methods: Techniques to analyze relationships between two quantitative variables.
- Unusual Features (Gaps, Clusters, Outliers): Distinct data characteristics like gaps (no data), clusters (grouped data), or outliers (extreme values).
The document Overview: Exploring Two-Variable Data Chapter Notes | AP Statistics - Grade 9 is a part of the Grade 9 Course AP Statistics.
All you need of Grade 9 at this link: Grade 9
|
12 videos|106 docs|12 tests
|
FAQs on Overview: Exploring Two-Variable Data Chapter Notes - AP Statistics - Grade 9
| 1. What is the difference between categorical and quantitative data in bivariate analysis? |  |
Ans.Categorical data refers to variables that can be divided into groups or categories, such as gender or color, while quantitative data involves numerical values that can be measured, such as height or weight. In bivariate analysis, understanding the type of data helps determine the appropriate statistical methods to use.
| 2. How can I interpret computer outputs for bivariate data on the AP Exam? | |
Ans.Computer outputs often include regression analysis, correlation coefficients, and graphical representations. To interpret these outputs, focus on the significance of p-values, the strength and direction of correlations, and any trends in scatterplots. Understanding these elements will help answer related questions on the exam.
| 3. What mathematical practices should I focus on for the AP Exam regarding two-variable data? | |
Ans.Focus on practices such as making sense of problems, reasoning abstractly and quantitatively, constructing viable arguments, and modeling with mathematics. These practices will enhance your ability to analyze data and apply mathematical concepts effectively during the exam.
| 4. What are the main concepts to understand when exploring two-variable data? | |
Ans.Key concepts include understanding relationships between variables, recognizing patterns in data, and using statistical measures like correlation and regression. Familiarity with these concepts will help you analyze bivariate data and answer exam questions accurately.
| 5. How does exam weighting impact the preparation for the AP Exam in statistics? | |
Ans.Exam weighting indicates the relative importance of different sections. By understanding which topics carry more weight, students can prioritize their study time effectively, focusing on areas that will have a greater impact on their overall exam scores.
About this Document

Oct 11, 2025
Last updated
Related Exams
Document Description: Chapter Notes: Overview: Exploring Two-Variable Data for Grade 9 2025 is part of AP Statistics preparation.
The notes and questions for Chapter Notes: Overview: Exploring Two-Variable Data have been prepared according to the Grade 9 exam syllabus. Information about Chapter Notes: Overview: Exploring Two-Variable Data covers topics
like Exam Weighting, Bivariate Data: Categorical vs. Quantitative and Chapter Notes: Overview: Exploring Two-Variable Data Example, for Grade 9 2025 Exam. Find important definitions, questions, notes, meanings, examples, exercises and tests below for Chapter Notes: Overview: Exploring Two-Variable Data.
Introduction of Chapter Notes: Overview: Exploring Two-Variable Data in English is available as part of our AP Statistics
for Grade 9 & Chapter Notes: Overview: Exploring Two-Variable Data in Hindi for AP Statistics course.
Download more important topics related with notes, lectures and mock test series for Grade 9
Exam by signing up for free. Grade 9: Overview: Exploring Two-Variable Data Chapter Notes | AP Statistics - Grade 9
Description
Full syllabus notes, lecture & questions for Overview: Exploring Two-Variable Data Chapter Notes | AP Statistics - Grade 9 - Grade 9 | Plus excerises question with solution to help you revise complete syllabus for AP Statistics | Best notes, free PDF download
Information about Chapter Notes: Overview: Exploring Two-Variable Data
In this doc you can find the meaning of Chapter Notes: Overview: Exploring Two-Variable Data defined & explained in the simplest way possible. Besides explaining types of
Chapter Notes: Overview: Exploring Two-Variable Data theory, EduRev gives you an ample number of questions to practice Chapter Notes: Overview: Exploring Two-Variable Data tests, examples and also practice Grade 9
tests

Related Searches
past year papers
,Important questions
,Overview: Exploring Two-Variable Data Chapter Notes | AP Statistics - Grade 9
,ppt
,study material
,mock tests for examination
,practice quizzes
,Objective type Questions
,Overview: Exploring Two-Variable Data Chapter Notes | AP Statistics - Grade 9
,Extra Questions
,video lectures
,MCQs
,Exam
,Overview: Exploring Two-Variable Data Chapter Notes | AP Statistics - Grade 9
,Summary
,Viva Questions
,Semester Notes
,shortcuts and tricks
,Free
,Sample Paper
,Previous Year Questions with Solutions
;


Additional Information about Chapter Notes: Overview: Exploring Two-Variable Data for Grade 9 Preparation
Chapter Notes: Overview: Exploring Two-Variable Data Free PDF Download
The Chapter Notes: Overview: Exploring Two-Variable Data is an invaluable resource that delves deep into the core of the Grade 9 exam.
These study notes are curated by experts and cover all the essential topics and concepts, making your preparation more efficient and effective.
With the help of these notes, you can grasp complex subjects quickly, revise important points easily,
and reinforce your understanding of key concepts. The study notes are presented in a concise and easy-to-understand manner,
allowing you to optimize your learning process. Whether you're looking for best-recommended books, sample papers, study material,
or toppers' notes, this PDF has got you covered. Download the Chapter Notes: Overview: Exploring Two-Variable Data now and kickstart your journey towards success in the Grade 9 exam.
Importance of Chapter Notes: Overview: Exploring Two-Variable Data
The importance of Chapter Notes: Overview: Exploring Two-Variable Data cannot be overstated, especially for Grade 9 aspirants.
This document holds the key to success in the Grade 9 exam.
It offers a detailed understanding of the concept, providing invaluable insights into the topic.
By knowing the concepts well in advance, students can plan their preparation effectively.
Utilize this indispensable guide for a well-rounded preparation and achieve your desired results.
Chapter Notes: Overview: Exploring Two-Variable Data
Chapter Notes: Overview: Exploring Two-Variable Data Notes offer in-depth insights into the specific topic to help you master it with ease.
This comprehensive document covers all aspects related to Chapter Notes: Overview: Exploring Two-Variable Data.
It includes detailed information about the exam syllabus, recommended books, and study materials for a well-rounded preparation.
Practice papers and question papers enable you to assess your progress effectively.
Additionally, the paper analysis provides valuable tips for tackling the exam strategically.
Access to Toppers' notes gives you an edge in understanding complex concepts.
Whether you're a beginner or aiming for advanced proficiency, Chapter Notes: Overview: Exploring Two-Variable Data Notes on EduRev are your ultimate resource for success.
Chapter Notes: Overview: Exploring Two-Variable Data Grade 9 Questions
The "Chapter Notes: Overview: Exploring Two-Variable Data Grade 9 Questions" guide is a valuable resource for all aspiring students preparing for the
Grade 9 exam. It focuses on providing a wide range of practice questions to help students gauge
their understanding of the exam topics. These questions cover the entire syllabus, ensuring comprehensive preparation.
The guide includes previous years' question papers for students to familiarize themselves with the exam's format and difficulty level.
Additionally, it offers subject-specific question banks, allowing students to focus on weak areas and improve their performance.
Study Chapter Notes: Overview: Exploring Two-Variable Data on the App
Students of Grade 9 can study Chapter Notes: Overview: Exploring Two-Variable Data alongwith tests & analysis from the EduRev app,
which will help them while preparing for their exam. Apart from the Chapter Notes: Overview: Exploring Two-Variable Data,
students can also utilize the EduRev App for other study materials such as previous year question papers, syllabus, important questions, etc.
The EduRev App will make your learning easier as you can access it from anywhere you want.
The content of Chapter Notes: Overview: Exploring Two-Variable Data is prepared as per the latest Grade 9 syllabus.
|
© EduRev
|
Education Revolution
|


|


Signup to see your scores
go up
within 7 days!
within 7 days!
Takes less than 10 seconds to signup