Grade 9 Exam > Grade 9 Notes > AP Statistics > Chapter Notes: Introducing Statistics: Are Variables Related?
Introducing Statistics: Are Variables Related? Chapter Notes | AP Statistics - Grade 9 PDF Download
| Table of contents |
|
| Types of Data |
|
| Bivariate Categorical Data |
|
| Bivariate Quantitative Data |
|
| Why Study Variable Relationships? |
|

Types of Data
Data in statistics can be broadly classified into two types: categorical and quantitative. Categorical data represents characteristics or attributes, often expressed as percentages or proportions (e.g., eye color or grade level). Quantitative data, on the other hand, consists of numerical values that can be averaged or measured (e.g., height or test scores).
Bivariate Categorical Data
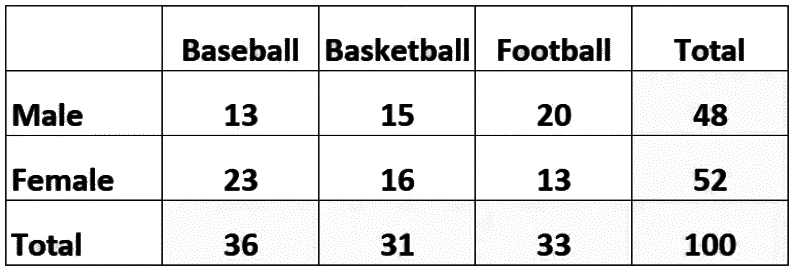
When studying relationships, we often collect data on two variables simultaneously. For instance, we might look at “grade level” (e.g., junior or senior) and “homework completion” (on time or not). This type of data, involving two categorical variables, is called bivariate categorical data.
To explore relationships between these variables, we can use several visualization tools:
- Histogram: A bar chart displaying the frequency of occurrences for each category combination. For example, it can show how many juniors and seniors complete homework on time versus those who don’t.
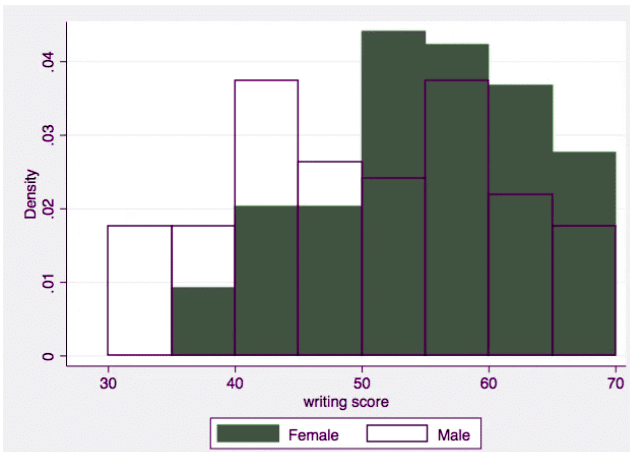
- Frequency Chart: Similar to a histogram but shows percentages instead of counts, making it easier to compare proportions across categories, like the percentage of students in each grade who finish homework on time.
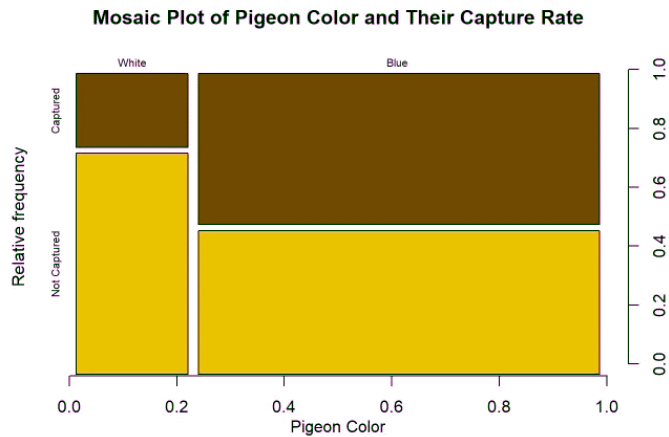
- Mosaic Plot: A visual tool that uses rectangles to represent the proportions of data in each category combination. The size of each rectangle reflects the frequency or proportion, helping to highlight relationships between the two variables.
Bivariate Quantitative Data
When both variables are numerical, such as plant height and amount of fertilizer used, we’re dealing with bivariate quantitative data. The goal is often to determine if there’s a correlation, like whether more fertilizer leads to taller plants.
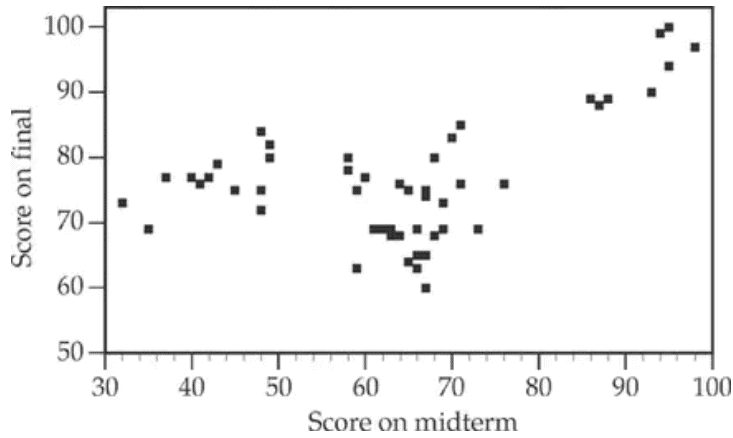
A primary tool for visualizing this data is the scatterplot. In a scatterplot, one variable is plotted on the x-axis and the other on the y-axis, allowing us to observe patterns or trends. For example, plotting fertilizer amounts against plant heights can reveal whether increased fertilizer correlates with taller plants (positive relationship) or shorter plants (negative relationship).
 Beyond visualization, statistical methods like correlation analysis can quantify the strength and direction of the relationship, helping determine if it’s significant and whether one variable can predict the other.
Why Study Variable Relationships?
Analyzing relationships between variables helps us understand if and how they influence each other. This can enable predictions—for example, knowing one variable’s value might help predict the other. Equally important, discovering that two variables are not related can be a significant finding, allowing us to rule out certain factors in a study.
Relationships between variables can be:
- Positive: As one variable increases, the other tends to increase (e.g., more study time, higher grades).
- Negative: As one variable increases, the other tends to decrease (e.g., more screen time, less sleep).
- No Relationship: No consistent pattern or trend exists between the variables.
Finding no relationship is just as valuable as finding one, as it helps narrow down factors affecting an outcome.
Question for Chapter Notes: Introducing Statistics: Are Variables Related?Try yourself: What type of data involves two categorical variables?View Solution
Key Terms to Review
- Bivariate Quantitative Data: Data involving two numerical variables, analyzed using scatterplots, correlation coefficients, or regression to uncover trends and relationships.
- Bivariate Categorical Data: Data involving two categorical variables, often displayed in contingency tables to show frequency or relationships between categories.
- Categorical Data: Variables grouped into distinct categories (e.g., gender, car type), used to analyze proportions and frequencies across groups.
- Frequency Chart: A visual tool showing the count or percentage of occurrences in each category, aiding in pattern identification.
- Histogram: A bar chart showing the frequency of data within intervals, useful for understanding the distribution of quantitative or categorical data.
- Mosaic Plot: A plot using rectangles to show proportions of categorical data, emphasizing relationships between two variables.
- Quantitative Data: Numerical data that can be measured or counted, used for statistical analysis and presented in charts or graphs.
The document Introducing Statistics: Are Variables Related? Chapter Notes | AP Statistics - Grade 9 is a part of the Grade 9 Course AP Statistics.
All you need of Grade 9 at this link: Grade 9
|
12 videos|106 docs|12 tests
|
FAQs on Introducing Statistics: Are Variables Related? Chapter Notes - AP Statistics - Grade 9
| 1. What is bivariate categorical data and how is it analyzed? |  |
Ans. Bivariate categorical data involves two categorical variables. To analyze this type of data, researchers often use contingency tables to observe the frequency of occurrences across different categories. Chi-square tests are commonly employed to determine if there is a significant association between the two variables.
| 2. What is bivariate quantitative data and what methods are used to analyze it? | |
Ans. Bivariate quantitative data consists of two numerical variables. It is analyzed using methods such as scatter plots to visually assess the relationship, and correlation coefficients to quantify the strength and direction of the relationship. Regression analysis can also be used to model the relationship between the variables.
| 3. Why is it important to study relationships between variables? | |
Ans. Studying relationships between variables helps to identify patterns and correlations, which can inform decision-making in various fields such as health, economics, and social sciences. Understanding these relationships can lead to better predictions and insights, guiding research and practical applications.
| 4. What are common examples of bivariate categorical data in real life? | |
Ans. Common examples include surveys that categorize responses by gender and preference, such as whether men or women prefer a certain product. Another example is examining the relationship between education level (e.g., high school, college) and employment status (e.g., employed, unemployed).
| 5. How do researchers determine if a relationship between two variables is statistically significant? | |
Ans. Researchers use statistical tests such as the Chi-square test for categorical data or t-tests and ANOVA for quantitative data to determine significance. A p-value is calculated; if it is below a predetermined threshold (commonly 0.05), the relationship is deemed statistically significant, indicating that it is unlikely to have occurred by chance.
About this Document

Oct 11, 2025
Last updated
Related Exams
Document Description: Chapter Notes: Introducing Statistics: Are Variables Related? for Grade 9 2025 is part of AP Statistics preparation.
The notes and questions for Chapter Notes: Introducing Statistics: Are Variables Related? have been prepared according to the Grade 9 exam syllabus. Information about Chapter Notes: Introducing Statistics: Are Variables Related? covers topics
like Types of Data, Bivariate Categorical Data, Bivariate Quantitative Data, Why Study Variable Relationships? and Chapter Notes: Introducing Statistics: Are Variables Related? Example, for Grade 9 2025 Exam. Find important definitions, questions, notes, meanings, examples, exercises and tests below for Chapter Notes: Introducing Statistics: Are Variables Related?.
Introduction of Chapter Notes: Introducing Statistics: Are Variables Related? in English is available as part of our AP Statistics
for Grade 9 & Chapter Notes: Introducing Statistics: Are Variables Related? in Hindi for AP Statistics course.
Download more important topics related with notes, lectures and mock test series for Grade 9
Exam by signing up for free. Grade 9: Introducing Statistics: Are Variables Related? Chapter Notes | AP Statistics - Grade 9
Description
Full syllabus notes, lecture & questions for Introducing Statistics: Are Variables Related? Chapter Notes | AP Statistics - Grade 9 - Grade 9 | Plus excerises question with solution to help you revise complete syllabus for AP Statistics | Best notes, free PDF download
Information about Chapter Notes: Introducing Statistics: Are Variables Related?
In this doc you can find the meaning of Chapter Notes: Introducing Statistics: Are Variables Related? defined & explained in the simplest way possible. Besides explaining types of
Chapter Notes: Introducing Statistics: Are Variables Related? theory, EduRev gives you an ample number of questions to practice Chapter Notes: Introducing Statistics: Are Variables Related? tests, examples and also practice Grade 9
tests

Related Searches
Summary
,Exam
,mock tests for examination
,study material
,Introducing Statistics: Are Variables Related? Chapter Notes | AP Statistics - Grade 9
,Introducing Statistics: Are Variables Related? Chapter Notes | AP Statistics - Grade 9
,Viva Questions
,practice quizzes
,ppt
,shortcuts and tricks
,video lectures
,past year papers
,Free
,Semester Notes
,Important questions
,Previous Year Questions with Solutions
,Sample Paper
,MCQs
,Extra Questions
,Objective type Questions
,Introducing Statistics: Are Variables Related? Chapter Notes | AP Statistics - Grade 9
;


Additional Information about Chapter Notes: Introducing Statistics: Are Variables Related? for Grade 9 Preparation
Chapter Notes: Introducing Statistics: Are Variables Related? Free PDF Download
The Chapter Notes: Introducing Statistics: Are Variables Related? is an invaluable resource that delves deep into the core of the Grade 9 exam.
These study notes are curated by experts and cover all the essential topics and concepts, making your preparation more efficient and effective.
With the help of these notes, you can grasp complex subjects quickly, revise important points easily,
and reinforce your understanding of key concepts. The study notes are presented in a concise and easy-to-understand manner,
allowing you to optimize your learning process. Whether you're looking for best-recommended books, sample papers, study material,
or toppers' notes, this PDF has got you covered. Download the Chapter Notes: Introducing Statistics: Are Variables Related? now and kickstart your journey towards success in the Grade 9 exam.
Importance of Chapter Notes: Introducing Statistics: Are Variables Related?
The importance of Chapter Notes: Introducing Statistics: Are Variables Related? cannot be overstated, especially for Grade 9 aspirants.
This document holds the key to success in the Grade 9 exam.
It offers a detailed understanding of the concept, providing invaluable insights into the topic.
By knowing the concepts well in advance, students can plan their preparation effectively.
Utilize this indispensable guide for a well-rounded preparation and achieve your desired results.
Chapter Notes: Introducing Statistics: Are Variables Related?
Chapter Notes: Introducing Statistics: Are Variables Related? Notes offer in-depth insights into the specific topic to help you master it with ease.
This comprehensive document covers all aspects related to Chapter Notes: Introducing Statistics: Are Variables Related?.
It includes detailed information about the exam syllabus, recommended books, and study materials for a well-rounded preparation.
Practice papers and question papers enable you to assess your progress effectively.
Additionally, the paper analysis provides valuable tips for tackling the exam strategically.
Access to Toppers' notes gives you an edge in understanding complex concepts.
Whether you're a beginner or aiming for advanced proficiency, Chapter Notes: Introducing Statistics: Are Variables Related? Notes on EduRev are your ultimate resource for success.
Chapter Notes: Introducing Statistics: Are Variables Related? Grade 9 Questions
The "Chapter Notes: Introducing Statistics: Are Variables Related? Grade 9 Questions" guide is a valuable resource for all aspiring students preparing for the
Grade 9 exam. It focuses on providing a wide range of practice questions to help students gauge
their understanding of the exam topics. These questions cover the entire syllabus, ensuring comprehensive preparation.
The guide includes previous years' question papers for students to familiarize themselves with the exam's format and difficulty level.
Additionally, it offers subject-specific question banks, allowing students to focus on weak areas and improve their performance.
Study Chapter Notes: Introducing Statistics: Are Variables Related? on the App
Students of Grade 9 can study Chapter Notes: Introducing Statistics: Are Variables Related? alongwith tests & analysis from the EduRev app,
which will help them while preparing for their exam. Apart from the Chapter Notes: Introducing Statistics: Are Variables Related?,
students can also utilize the EduRev App for other study materials such as previous year question papers, syllabus, important questions, etc.
The EduRev App will make your learning easier as you can access it from anywhere you want.
The content of Chapter Notes: Introducing Statistics: Are Variables Related? is prepared as per the latest Grade 9 syllabus.
|
© EduRev
|
Education Revolution
|


|


Signup to see your scores
go up within 7 days!
Access 1000+ FREE Docs, Videos and Tests
Takes less than 10 seconds to signup