Grade 9 Exam > Grade 9 Notes > AP Statistics > Chapter Notes: Parameters for a Binomial Distribution
Parameters for a Binomial Distribution Chapter Notes | AP Statistics - Grade 9 PDF Download

In order to use the binomial distribution to model a random event, the event must meet the following four conditions:
- Binary: The possible outcomes of each trial can be classified as a success or a failure.
- Independent: Trials must be independent. Knowing the outcome of one trial must not inform the outcome of any other trial.
- Fixed number: The number of trials n must be fixed in advance.
- Same probability: There must be the same probability of success p on each trial.
(A mnemonic device that might help is BINS: binary, independent, number, same probability!)
If any of these conditions is not met, then the event cannot be modeled using the binomial distribution. For example, if you want to model the number of heads in 10 flips of a biased coin with varying probabilities of heads, then the event cannot be modeled using the binomial distribution.
Describing Mean and Standard Deviation of Binomial Variables
Before proceeding, it's important to note that these formulae only apply in binomial settings, where the conditions for the binomial distribution are met.

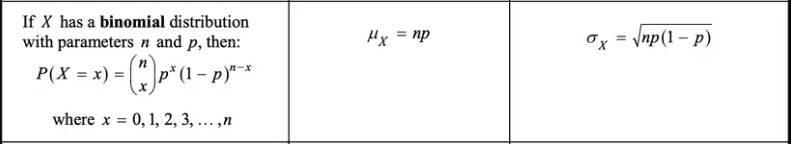
- Mean: The mean (expected value) of a binomial random variable X, representing the number of successes in n independent trials with probability of success p, is given by: mean = E(X) = n * p
- Standard deviation: The standard deviation of a binomial random variable X is given by: standard deviation = σX = sqrt(n * p * (1 - p))
Binomial Distributions in Statistical Sampling
Another important rule is the 10% condition, which states that if you are taking a random sample of size n from a population of size N, and n is less than 10% of N (i.e., n</>N), then you can use a binomial model to describe the number of successes in the sample.
This rule is based on the assumption that the sample is representative of the population, and the probability of success is the same in the sample as it is in the population. If these assumptions are not met, the binomial model may not be appropriate.
Question for Chapter Notes: Parameters for a Binomial DistributionTry yourself: What is one of the conditions for using the binomial distribution?View Solution
Key Terms to Review
- 10% Condition: A guideline ensuring that the sample size taken from a population is small enough relative to the population size, typically indicating that the sample size should be less than 10% of the total population.
- Binomial Distribution: A probability distribution summarizing the likelihood of a given number of successes in a fixed number of independent Bernoulli trials.
- Expected Value: Represents the average outcome of a random variable based on its possible values, weighted by the likelihood of occurrence.
- Failure: The outcome that is not classified as a success in a binomial distribution.
- Mean: A measure of central tendency that represents the average value of a set of numbers.
- Probability of Success: The likelihood that a given outcome will occur in a statistical experiment.
- Random Variable: A numerical outcome of a random process, classified into discrete and continuous types.
- Random Sample: A subset of individuals chosen from a larger population where each individual has an equal chance of being selected.
- Standard Deviation: A measure of the amount of variation or dispersion in a set of values.
The document Parameters for a Binomial Distribution Chapter Notes | AP Statistics - Grade 9 is a part of the Grade 9 Course AP Statistics.
All you need of Grade 9 at this link: Grade 9
|
12 videos|106 docs|12 tests
|
FAQs on Parameters for a Binomial Distribution Chapter Notes - AP Statistics - Grade 9
| 1. What are the key parameters of a binomial distribution? |  |
Ans. The key parameters of a binomial distribution are n and p. Here, n represents the number of trials, and p represents the probability of success on each trial. The binomial distribution models the number of successes in n independent Bernoulli trials.
| 2. How do you calculate the mean of a binomial distribution? | |
Ans. The mean of a binomial distribution can be calculated using the formula: mean = n * p, where n is the total number of trials and p is the probability of success on each trial.
| 3. What is the formula for the variance of a binomial distribution? | |
Ans. The variance of a binomial distribution is calculated using the formula: variance = n * p * (1 - p). This formula takes into account the number of trials (n), the probability of success (p), and the probability of failure (1 - p).
| 4. Can you explain what a Bernoulli trial is in the context of a binomial distribution? | |
Ans. A Bernoulli trial is a random experiment that results in a binary outcome – typically labeled as "success" or "failure." In the context of a binomial distribution, a series of Bernoulli trials are performed, and the binomial distribution describes the number of successes in these trials.
| 5. How do you determine if a situation can be modeled by a binomial distribution? | |
Ans. A situation can be modeled by a binomial distribution if it meets the following criteria: there are a fixed number of trials (n), each trial has two possible outcomes (success or failure), the trials are independent, and the probability of success (p) remains constant for each trial.
About this Document

Oct 02, 2025
Last updated
Related Exams
Document Description: Chapter Notes: Parameters for a Binomial Distribution for Grade 9 2025 is part of AP Statistics preparation.
The notes and questions for Chapter Notes: Parameters for a Binomial Distribution have been prepared according to the Grade 9 exam syllabus. Information about Chapter Notes: Parameters for a Binomial Distribution covers topics
like and Chapter Notes: Parameters for a Binomial Distribution Example, for Grade 9 2025 Exam. Find important definitions, questions, notes, meanings, examples, exercises and tests below for Chapter Notes: Parameters for a Binomial Distribution.
Introduction of Chapter Notes: Parameters for a Binomial Distribution in English is available as part of our AP Statistics
for Grade 9 & Chapter Notes: Parameters for a Binomial Distribution in Hindi for AP Statistics course.
Download more important topics related with notes, lectures and mock test series for Grade 9
Exam by signing up for free. Grade 9: Parameters for a Binomial Distribution Chapter Notes | AP Statistics - Grade 9
Description
Full syllabus notes, lecture & questions for Parameters for a Binomial Distribution Chapter Notes | AP Statistics - Grade 9 - Grade 9 | Plus excerises question with solution to help you revise complete syllabus for AP Statistics | Best notes, free PDF download
Information about Chapter Notes: Parameters for a Binomial Distribution
In this doc you can find the meaning of Chapter Notes: Parameters for a Binomial Distribution defined & explained in the simplest way possible. Besides explaining types of
Chapter Notes: Parameters for a Binomial Distribution theory, EduRev gives you an ample number of questions to practice Chapter Notes: Parameters for a Binomial Distribution tests, examples and also practice Grade 9
tests

Related Searches
ppt
,past year papers
,video lectures
,Semester Notes
,MCQs
,Parameters for a Binomial Distribution Chapter Notes | AP Statistics - Grade 9
,shortcuts and tricks
,practice quizzes
,Parameters for a Binomial Distribution Chapter Notes | AP Statistics - Grade 9
,Extra Questions
,Exam
,Free
,mock tests for examination
,Summary
,Objective type Questions
,Important questions
,study material
,Viva Questions
,Parameters for a Binomial Distribution Chapter Notes | AP Statistics - Grade 9
,Sample Paper
,Previous Year Questions with Solutions
;


Additional Information about Chapter Notes: Parameters for a Binomial Distribution for Grade 9 Preparation
Chapter Notes: Parameters for a Binomial Distribution Free PDF Download
The Chapter Notes: Parameters for a Binomial Distribution is an invaluable resource that delves deep into the core of the Grade 9 exam.
These study notes are curated by experts and cover all the essential topics and concepts, making your preparation more efficient and effective.
With the help of these notes, you can grasp complex subjects quickly, revise important points easily,
and reinforce your understanding of key concepts. The study notes are presented in a concise and easy-to-understand manner,
allowing you to optimize your learning process. Whether you're looking for best-recommended books, sample papers, study material,
or toppers' notes, this PDF has got you covered. Download the Chapter Notes: Parameters for a Binomial Distribution now and kickstart your journey towards success in the Grade 9 exam.
Importance of Chapter Notes: Parameters for a Binomial Distribution
The importance of Chapter Notes: Parameters for a Binomial Distribution cannot be overstated, especially for Grade 9 aspirants.
This document holds the key to success in the Grade 9 exam.
It offers a detailed understanding of the concept, providing invaluable insights into the topic.
By knowing the concepts well in advance, students can plan their preparation effectively.
Utilize this indispensable guide for a well-rounded preparation and achieve your desired results.
Chapter Notes: Parameters for a Binomial Distribution
Chapter Notes: Parameters for a Binomial Distribution Notes offer in-depth insights into the specific topic to help you master it with ease.
This comprehensive document covers all aspects related to Chapter Notes: Parameters for a Binomial Distribution.
It includes detailed information about the exam syllabus, recommended books, and study materials for a well-rounded preparation.
Practice papers and question papers enable you to assess your progress effectively.
Additionally, the paper analysis provides valuable tips for tackling the exam strategically.
Access to Toppers' notes gives you an edge in understanding complex concepts.
Whether you're a beginner or aiming for advanced proficiency, Chapter Notes: Parameters for a Binomial Distribution Notes on EduRev are your ultimate resource for success.
Chapter Notes: Parameters for a Binomial Distribution Grade 9 Questions
The "Chapter Notes: Parameters for a Binomial Distribution Grade 9 Questions" guide is a valuable resource for all aspiring students preparing for the
Grade 9 exam. It focuses on providing a wide range of practice questions to help students gauge
their understanding of the exam topics. These questions cover the entire syllabus, ensuring comprehensive preparation.
The guide includes previous years' question papers for students to familiarize themselves with the exam's format and difficulty level.
Additionally, it offers subject-specific question banks, allowing students to focus on weak areas and improve their performance.
Study Chapter Notes: Parameters for a Binomial Distribution on the App
Students of Grade 9 can study Chapter Notes: Parameters for a Binomial Distribution alongwith tests & analysis from the EduRev app,
which will help them while preparing for their exam. Apart from the Chapter Notes: Parameters for a Binomial Distribution,
students can also utilize the EduRev App for other study materials such as previous year question papers, syllabus, important questions, etc.
The EduRev App will make your learning easier as you can access it from anywhere you want.
The content of Chapter Notes: Parameters for a Binomial Distribution is prepared as per the latest Grade 9 syllabus.
|
© EduRev
|
Education Revolution
|


|


Signup on EduRev and stay on top of your study goals
10M+ students crushing their study goals daily