Sampling Distributions for Sample Means Chapter Notes | AP Statistics - Grade 9 PDF Download

Formulas
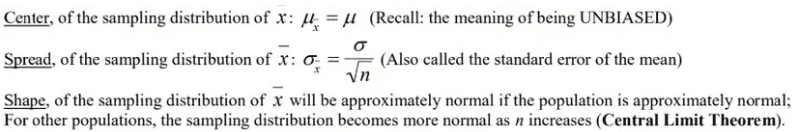
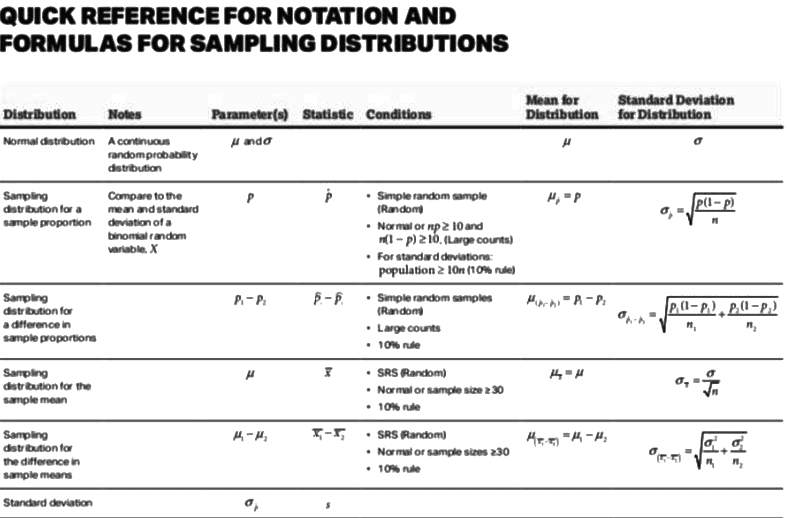
For these problems, you are given a sample mean. The average of sample means is equal to the given mean.
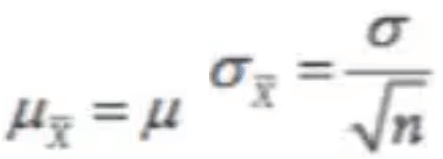
For the standard deviation, when you deal with sample statistics, you must use standard error (SE). This version of standard deviation is crucial for understanding population proportions and must be memorized just like the chart in section 5.1.
Normal Condition: Central Limit Theorem
When working with numerical data to estimate the mean of a population, you can use the sampling distribution of the sample mean (x̄) to make inferences about the population mean. However, you must first assure that the sampling distribution is normally distributed using the Central Limit Theorem.
One important property of the sampling distribution of the sample mean is that it is approximately normal, provided the sample size is large enough. This means that even if the population distribution is not normal, the sampling distribution can be modeled using a normal distribution if the sample size is large enough.
The "large enough" sample size is often taken to be 30 or greater. This is known as the Central Limit Theorem, which states that the sampling distribution of the sample mean becomes approximately normal as the sample size increases, regardless of the shape of the population distribution.
Practice Problem
Suppose you are conducting a study to estimate the average income of small business owners in your state. You decide to use a simple random sample of 100 small business owners and collect data on their annual incomes. After analyzing the data, you find that the sample mean income is $10,000.
(a) Explain what the sampling distribution for the sample mean represents and why it is useful in this situation.
(b) Suppose that the true population mean income for small business owners in your state is actually $45,000 per year. Describe the shape, center, and spread of the sampling distribution for the sample mean in this case.
(c) Explain why the Central Limit Theorem applies to the sampling distribution for the sample mean in this situation.
(d) Discuss one potential source of bias that could affect the results of this study, and explain how it could influence the estimate of the population mean income.
Answer: (a) The sampling distribution for the sample mean represents the distribution of possible values for the sample mean if the study were repeated many times. It is useful because it allows us to make inferences about the population mean based on the sample data.
(b) If the true population mean income for small business owners in your state is $45,000, the sampling distribution would be:
- Approximately normal due to the sample size.
- Centered around $45,000.
- Spread determined by the standard error.
(c) The Central Limit Theorem applies because the sample size (n = 100) is large enough for the distribution to be approximately normal, even if the population is not normally distributed.
(d) One potential source of bias could be selection bias. For instance, if the sample is drawn from a list of small business owners who have registered with a specific organization, it may be biased toward those who are more financially successful. This could lead to an overestimate of the population mean income.
Conversely, if the sample is drawn from a list of small business owners applying for a loan program, it might be biased toward those who are less financially successful, leading to an underestimate of the population mean income.
Key Terms to Review
- Bias: A systematic error leading to incorrect or misleading representations of a population or phenomenon.
- Central Limit Theorem: States that the sampling distribution of the sample mean approaches a normal distribution as the sample size increases, regardless of the population's distribution.
- Normal Distribution: A continuous probability distribution characterized by a symmetric, bell-shaped curve.
- Population Mean: The average value of a set of observations for an entire population.
- Sample Mean: The average value calculated from a subset of data.
- Sampling Distribution: A probability distribution of a statistic obtained by selecting random samples from a population.
- Selection Bias: Occurs when the sample does not accurately represent the larger population.
- Simple Random Sample: A selection of individuals from a population where each has an equal chance of being chosen.
- Standard Error (SE): Measures the accuracy of a sample mean as an estimate of the population mean.
|
12 videos|106 docs|12 tests
|
FAQs on Sampling Distributions for Sample Means Chapter Notes - AP Statistics - Grade 9
| 1. What is the Central Limit Theorem (CLT) and why is it important in statistics? |  |
| 2. How does sample size affect the Central Limit Theorem? | |
| 3. What conditions must be met for the Central Limit Theorem to apply? | |
| 4. How do you calculate the standard error of the mean using the Central Limit Theorem? | |
| 5. Can the Central Limit Theorem be applied to non-normally distributed populations? | |


Exam
,ppt
,video lectures
,Sampling Distributions for Sample Means Chapter Notes | AP Statistics - Grade 9
,practice quizzes
,Extra Questions
,shortcuts and tricks
,Semester Notes
,Free
,mock tests for examination
,Important questions
,Viva Questions
,MCQs
,Sampling Distributions for Sample Means Chapter Notes | AP Statistics - Grade 9
,Objective type Questions
,Sample Paper
,Previous Year Questions with Solutions
,Summary
,Sampling Distributions for Sample Means Chapter Notes | AP Statistics - Grade 9
,past year papers
,study material
;


Chapter Notes: Sampling Distributions for Sample Means Free PDF Download
Importance of Chapter Notes: Sampling Distributions for Sample Means
Chapter Notes: Sampling Distributions for Sample Means
Chapter Notes: Sampling Distributions for Sample Means Grade 9 Questions
Study Chapter Notes: Sampling Distributions for Sample Means on the App
|
© EduRev
|
Education Revolution
|


|


