Overview: Inference for Categorical Data: Proportions Chapter Notes | AP Statistics - Grade 9 PDF Download

This unit introduces statistical inference, which will continue through the end of the course. Students will analyze categorical data to make inferences about binomial population proportions. Provided conditions are met, students will use statistical inference to construct and interpret confidence intervals to estimate population proportions and perform significance tests to evaluate claims about population proportions. Students begin by learning inference procedures for one proportion and then examine inference methods for a difference between two proportions. They will also interpret the two types of errors that can be made in a significance test, their probabilities, and possible consequences in context.
Have you ever seen a statistic, perhaps on Facebook or Twitter, and had your doubts? Maybe you read a statistic such as this one: "The proportion of goofy footed snowboarders who contract cancer is higher than those that are regular footed." Sounds pretty goofy, right?
It's certainly possible to come across statistics that seem questionable or that you might have doubts about. When encountering a statistic like this, it's always a good idea to try to verify the information and consider the context in which it is presented. This might involve looking for additional sources or seeking out more information about the study or data that the statistic is based on. It's also important to be aware of potential biases or agendas that might be influencing the way the statistic is presented.
The process that scientists and data analysts use to make that conclusion comes from a process called statistical inference. Inference is a process where a study is performed on a small sample of a population in which we compare two groups or perhaps one group to a given population. Through calculations involving the normal distribution, we can estimate what the true population parameter is or we can test a claim about a population given in an article of study using our sample statistics.
Big Ideas:
- To estimate or predict a population parameter, we use a confidence interval!
- To test a claim, we use a significance test!
Confidence Intervals
For this unit, we are going to be estimating population parameters involving categorical data. This means that our sample statistic will be a sample proportion and we will be using that to estimate, or test against, a population proportion.
The first process we are going to use is a confidence interval. A confidence interval is an interval of numbers based on our sample proportion that gives us a range where we can expect to find the true population proportion. A confidence interval will be based on three things: sample proportion, sample size, and confidence level (usually 95%).
(1) Sample Proportion
It's important that the sample used to calculate a statistic be randomly selected in order to accurately represent the population. If the sample is not randomly selected, it can be biased and the resulting statistic (like the sample proportion) may not accurately represent the population. For example, if the sample used to calculate a statistic is not representative of the entire population, the statistic may not be a good estimate of the population parameter. This is why random sampling is important – it helps to ensure that the sample is representative of the population and that the resulting statistic is a good estimate of the population parameter.
That being said, the first aspect of our confidence interval is our sample proportion. In order for our sample proportion to be a good estimate of our population proportion, it is necessary that it comes from a random sample. As mentioned before, there is no way to fix the lack of randomness in a sample.
(2) Sample Size
Our sample size is also an important measure when used to calculate a confidence interval. Our sample size must be large enough that we can use a normal distribution to estimate our population proportion. In order to see that condition, refer back to what we said in Unit 5 with Sampling Distributions.
- The standard deviation of the sampling distribution of a statistic decreases as the sample size increases.
This means that as the sample size increases, the sample statistic is less likely to be far from the true population parameter. As a result, the confidence interval for the population parameter will be narrower for a larger sample size. The standard deviation of the sampling distribution of a statistic decreases as the sample size increases.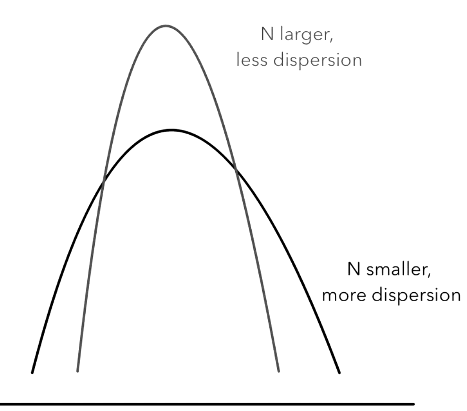 For example, let's say we are trying to estimate the proportion of people in a population who support a certain policy. If we have a sample size of 50, the standard deviation of the sampling distribution of the sample proportion will be larger than if we had a sample size of 500. This means that the confidence interval for the population proportion will be wider for a sample size of 50 compared to a sample size of 500. In other words, we'll be less confident in our estimate of the population proportion if we have a smaller sample size.
(3) Confidence Level
The confidence level is a measure of how confident we are that the confidence interval contains the true population parameter (i.e., true proportion of our population). It is expressed as a percentage and is calculated by considering the number of confidence intervals that would contain the true population parameter if we were to take multiple samples from the same population and construct confidence intervals for each sample.
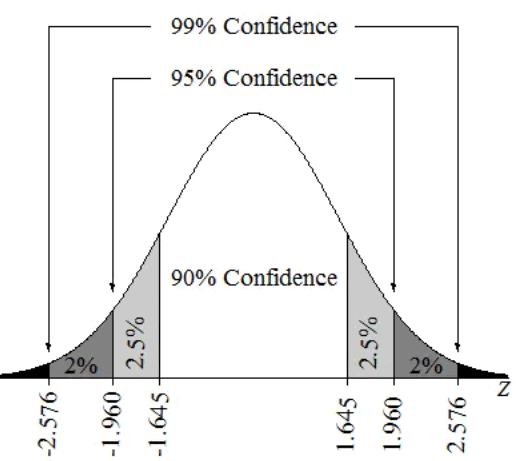
The confidence level is chosen by the researcher and is typically set at a higher level, such as 90%, 95%, or 99%, to increase the confidence that the true population parameter is contained within the confidence interval. A higher confidence level will result in a wider confidence interval, but it will also increase the likelihood that the interval contains the true population parameter.
 For example, if we set the confidence level to 95%, this means that if we were to take multiple samples from the same population and create a confidence interval for each sample, approximately 95% of those intervals would contain the true population parameter.Another way to think of this is if we were to take 100 different samples from the same population and create 100 different 95% confidence intervals, ~95 of those 100 confidence intervals would contain the true proportion we are trying to estimate.
Our confidence level is also a key part of our confidence level because it determines our z* or critical value based on the standard normal distribution. As our confidence level increases, so does our z*, which in turn increases the range of our confidence interval.
Significance Tests
When we are given a population parameter and we have some reason to believe that it is false, we can perform a significance test to check if that value is correct. With a significance test, we are going to estimate the probability of obtaining our collected sample from the sampling distribution of our sample size when we assume that the given population proportion is correct. If the probability of obtaining our collected sample is low given those two factors (claimed population proportion and our sample size), we might have reason to reject the claim or at least investigate it further. ️
As we had with confidence intervals and sampling distributions, our significance test hinges on the fact that we must meet the three conditions of inference: randomness, independence, and normality. Otherwise, our sample isn't reflective of the population, our standard deviation isn't accurate, or our sampling distribution isn't normal so we cannot accurately calculate the probability of obtaining our sample.
Inference with Two Proportions
Just as we mentioned in Unit 5, we also may have to create confidence intervals or perform significance tests with two proportions. This is typically used in experimental design when comparing two samples to see the effectiveness of certain treatments.
As mentioned in Unit 5, our conditions for inference must be met with both samples and we can subtract our two centers to find the center of the sampling distribution between two proportions. The standard deviation for this sampling distribution can be found on the reference page provided for AP testing.
For example, if a researcher is testing the effectiveness of a particular medicine or drug, the experimental design would randomly assign participants to a placebo group or the new treatment group. We would assume that there is no difference in the two groups and then compare the sample proportions of who recovered quicker between the two groups and if that difference is significant, then we would have an effective medicinal treatment.
Key Terms to Review
- Binomial Population Proportions: The proportion of successes in a fixed number of independent Bernoulli trials.
- Categorical Data: Variables divided into distinct groups or categories.
- Confidence Intervals: A range of values estimating a population parameter with a specified level of confidence.
- Confidence Level: The degree of certainty that a parameter falls within a specified confidence interval, often expressed as a percentage.
- Critical Value: A point on the scale of the test statistic used to determine whether to reject the null hypothesis.
- Experimental Design: The process of planning an experiment to ensure valid conclusions about cause-and-effect relationships.
- Independence: The occurrence of one event does not affect the occurrence of another.
- Population Proportions: Fractions or percentages of individuals within a population possessing a certain characteristic.
- Randomness: The lack of pattern or predictability in events.
- Sample Proportion: The ratio of the number of successes in a sample to the total number of observations in that sample.
- Sampling Distributions: The probability distribution of a statistic obtained from a large number of samples.
- Significance Tests: Methods to determine whether observed data significantly deviates from what would be expected under a specific hypothesis.
- Standard Deviation: A measure of the amount of variation or dispersion in a set of values.
- Statistical Inference: The process of using data from a sample to make generalizations about a population.
|
12 videos|106 docs|12 tests
|
FAQs on Overview: Inference for Categorical Data: Proportions Chapter Notes - AP Statistics - Grade 9
| 1. What is a sample proportion, and why is it important in confidence intervals? |  |
| 2. How does sample size affect the width of a confidence interval? | |
| 3. What does the confidence level represent in a confidence interval? | |
| 4. What conditions must be met for conducting significance tests? | |
| 5. How can we compare two population proportions using confidence intervals? | |


Previous Year Questions with Solutions
,Free
,Important questions
,Overview: Inference for Categorical Data: Proportions Chapter Notes | AP Statistics - Grade 9
,Semester Notes
,past year papers
,shortcuts and tricks
,Exam
,video lectures
,Summary
,Extra Questions
,Viva Questions
,study material
,Overview: Inference for Categorical Data: Proportions Chapter Notes | AP Statistics - Grade 9
,Objective type Questions
,practice quizzes
,mock tests for examination
,MCQs
,Sample Paper
,ppt
,Overview: Inference for Categorical Data: Proportions Chapter Notes | AP Statistics - Grade 9
;


Chapter Notes: Overview: Inference for Categorical Data: Proportions Free PDF Download
Importance of Chapter Notes: Overview: Inference for Categorical Data: Proportions
Chapter Notes: Overview: Inference for Categorical Data: Proportions
Chapter Notes: Overview: Inference for Categorical Data: Proportions Grade 9 Questions
Study Chapter Notes: Overview: Inference for Categorical Data: Proportions on the App
|
© EduRev
|
Education Revolution
|


|


