Chapter Notes: Constructing a Confidence Interval for a Population Proportion

A confidence interval is a range of values calculated from sample data used to estimate a population parameter. In the case of categorical data, a confidence interval is used to estimate a population proportion.
Confidence Interval
The confidence interval is based on the sample proportion, sample size, and the sampling distribution of the sample size. The sampling distribution is the distribution of the sample statistic (in this case, the sample proportion) that would be obtained if we were to take multiple samples from the population.
The confidence level reflects how confident we are that the confidence interval contains the true population parameter. The standard confidence level is usually 95%.
As the confidence level increases, the width of our interval also increases.
Checking Conditions
Random Sample
This reduces any bias that may arise from taking a non-representative sample. It's essential to note that our sample was random, either by highlighting text on the exam or quoting the problem where it discusses its randomness. Without a random sample, our findings cannot be generalized to a population, leading to inaccurate scope of inference.
Independence
This ensures that each subject in our sample was not influenced by the previous subjects chosen. If sampling without replacement, the effect is negligible if our sample size is not too close to our population size. Check if it is reasonable to believe that the population is at least 10 times as large as our sample.
For example, if we have a random sample of 85 teenagers' math grades, we could state, "It is reasonable to believe that there are at least 850 teenagers currently enrolled in a math class."
To sum this up: When sampling without replacement, check that n ≤ 10%N, where N is the size of the population. A good way to state this is, "It is reasonable to believe that our population (in context) is at least 10n."
Normal
This check verifies that we can use a normal curve to calculate probabilities using either the empirical rule or z-scores. Verify that the sampling distribution is normal using the Large Counts Condition, which requires at least 10 expected successes and 10 expected failures.
For instance, if 70% of all teenagers pass their math class, with a sample of 85, we have 0.7(85) = 59.5 (greater than 10). We also check the complement: 0.3(85) = 25.5 (also greater than 10).
Since both np and n(1-p) are greater than or equal to 10, we conclude that the sampling distribution of our proportion will be approximately normal.
One Sample z-interval for Proportions
A one-sample z-interval for a proportion is appropriate for constructing a confidence interval for a single population proportion based on a sample of categorical data. This procedure uses a z-test to estimate the population proportion based on the sample proportion and the sample size.
The one-sample z-interval for a proportion is used when:
- The sample is random, or the sample size is large enough (usually n > 30) to use the normal approximation.
- The data are collected from a single categorical variable (e.g., yes/no).
- The sample size is sufficient to use the normal approximation.
- The population proportion is unknown and needs to be estimated from the sample.
Calculating the Interval
Calculating a confidence interval is based on two things: our point estimate and our margin of error.
(1) Point Estimate: The point estimate for a confidence interval estimating a population proportion is the sample proportion (p-hat). It serves as the estimate of the population proportion based on the sample data.
The sample proportion is the midpoint of the confidence interval used to calculate its bounds.
(2) Margin of Error: The margin of error is the "buffer zone" of the confidence interval, allowing for potential error or uncertainty in estimating the population parameter. This is added and subtracted from the sample proportion to account for error in our interval.
The margin of error is based on the critical value (z-score), determined by the confidence level, and the standard deviation of the sampling distribution. For instance, if the confidence level is 95%, the critical value is usually 1.96.
The sample size significantly impacts the margin of error. As the sample size increases, the standard deviation of the sampling distribution decreases, resulting in a smaller margin of error. This means the confidence interval becomes narrower and the estimate of the population parameter becomes more precise
Formula and Some Notes
 Note that the formula for the margin of error can be rearranged to solve for the minimum sample size needed to achieve a given margin of error:
Margin of error = z * standard error of the proportion, where z is the critical value and the standard error is calculated using the sample size and the population proportion (assumed equal to the sample proportion).
To find the minimum sample size for a desired margin of error, rearrange the formula:
n = (z / margin of error)² * p * (1 - p), where n is the sample size, z is the critical value, margin of error is the desired amount, p is the population proportion (assumed equal to the sample proportion), and 1 - p is the population proportion of the other category.
If finding an upper bound for the sample size, use a guess for p or p = 0.5 to find the maximum sample size for a given margin of error.
Using a Calculator
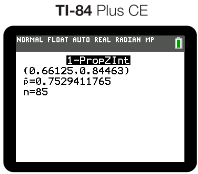
A more efficient way to calculate a confidence interval is to use a graphing calculator. For instance, with a Texas Instruments TI-84, select 1-Prop Z Interval from the Stats menu, enter your number of successes (x), sample size (n), and confidence level. Calculate to get the confidence interval! ️
Key Terms
- Bias: A systematic error that leads to an incorrect representation of a population or phenomenon.
- Categorical Data: Variables divided into distinct groups or categories, used for analyzing relationships.
- Confidence Level: A measure of certainty that a parameter falls within a specified confidence interval, often expressed as a percentage.
- Confidence Interval: A range of values likely to contain the true value of a population parameter based on sample statistics.
- Critical Value (z-score): A point on the standard normal distribution corresponding to a specified probability or confidence level.
- Dichotomous Variable: A categorical variable with two possible values, essential for analyzing proportions.
- Empirical Rule: For a normal distribution, approximately 68% of data falls within one standard deviation, 95% within two, and 99.7% within three.
- Independence: The occurrence of one event does not affect the occurrence of another, crucial for statistical methods.
- Margin of Error: Quantifies uncertainty associated with a sample estimate, reflecting the range within which the true population parameter is expected to fall.
- Normal Curve: A symmetrical, bell-shaped distribution representing the probability distribution of a continuous random variable.
- P-hat (sample proportion): Represents the proportion of a certain outcome in a sample, calculated as successes divided by total observations.
- Point Estimate: A single value that approximates a population parameter based on sample data.
- Population Parameter: A numerical value that describes a characteristic of an entire population.
- Population Proportion: The fraction of a population exhibiting a certain characteristic, represented by the symbol p.
- Random Sample: A subset chosen from a larger population where each individual has an equal chance of selection.
- Sampling Distribution: A probability distribution of a statistic obtained by selecting random samples from a population.
- Standard Error of the Proportion: Estimates the variability of sample proportions from the true population proportion.
- Standard Deviation: A measure of variation or dispersion in a set of values, indicating how much individual data points deviate from the mean.
FAQs on Chapter Notes: Constructing a Confidence Interval for a Population Proportion
| 1. What is a confidence interval for a population proportion? |  |
| 2. Why is it important to have a random sample when constructing a confidence interval? | |
| 3. What are the conditions that must be checked before calculating a confidence interval for a population proportion? | |
| 4. How is the margin of error calculated in a confidence interval for a proportion? | |
| 5. What is the role of the sample size in determining the width of a confidence interval? | |


