Justifying a Claim Based on a Confidence Interval for a Population Proportion Chapter Notes | AP Statistics - Grade 9 PDF Download
| Table of contents |
|
| Concluding a Confidence Interval |
|
| The Big Three |
|
| Testing a Claim Using Intervals |
|
| Sample Size, Confidence Interval Width, Confidence Level, and Margin of Error |
|

A confidence interval for a population proportion is based on sample data and is used to estimate the likely range of values for the population proportion. The confidence interval is constructed at a specific confidence level, which determines the probability that the interval contains the true population proportion.
Since each confidence interval is based on a random sample of data, the interval will either contain the population proportion or it will not. There is a specified probability, based on the confidence level, that the interval will contain the true population proportion. For example, if the confidence level is 95%, there is a 95% probability that the interval contains the true population proportion.
Concluding a Confidence Interval
Let's return to our confidence interval that was given before:
We are estimating a 95% confidence interval of what proportion of high school math students pass their class. We were given a sample of 85 students where ~75% of them passed. We calculated a confidence interval for the true population proportion based off of our sample. The interval is given in the calculator output below:
True Population Proportion
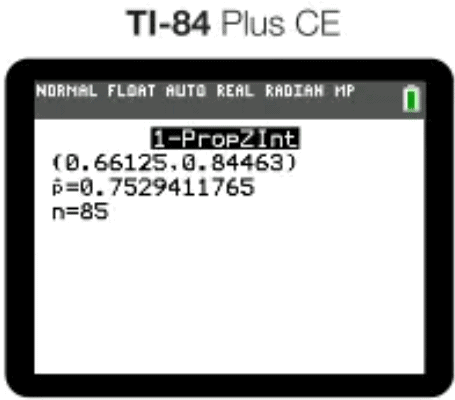
We are given the 95% confidence interval (0.66125, 0.84463) as an estimate of the population proportion of high school students who are passing their math class.
Huh? What the Heck Does This Mean?
In terms of what this means, it means we are 95% confident that the true population proportion of high school students who pass their math class is between 0.66125 and 0.84463. Notice that both of our endpoints are decimals less than 1. This is because we are estimating a proportion, which is always between 0 and 1. Anytime we are calculating any type of proportion, our answer should always be between 0 and 1.
Interpretation Templates
Interpreting a confidence interval for a one-sample proportion should include a reference to the sample taken and details about the population it represents.
- “We are C% (90%, 95%, 99%, etc.) confident that the confidence interval for a population proportion captures the population proportion of (CONTEXT).”
Example: For interpreting a 99% confidence interval of (0.268, 0.292), based on the proportion of a nationally representative sample of twelfth-grade students who answered a particular multiple choice question correctly: “We are 99 percent confident that the interval from 0.268 to 0.292 contains the population proportion of all United States twelfth-grade students who would answer this question correctly.”
- “In repeated random sampling with the same sample size, approximately C% of confidence intervals created will capture the population proportion of (CONTEXT).”
The Big Three
When interpreting a confidence interval for a population proportion, there are three things necessary to receive full credit: confidence level, context, and reference to true population proportion.
True Population Proportion.
- Confidence Level: Our confidence level is generally given in the problem. This is the 95%, 90%, 98%, etc. This impacts the z* for our confidence interval and is necessary in including in our interpretation of the interval.
- Context: As with anything in AP Stats, context is essential to receive full credit. Anytime we write out an answer, we need to include it in context of the problem being asked. It is no different when interpreting a confidence interval. We need to ask ourselves, “What is this interval estimating?” and include that in our response.
- True Population Parameter: We also need to be sure that our answer implies that we are estimating a population proportion, not just a sample proportion. After all, there's no reason to estimate something for our sample because we have the EXACT sample proportion as it was given to us. We are using that sample to estimate the bigger picture with our population.
Testing a Claim Using Intervals
When we are given a population proportion that maybe we don't necessarily believe, we can use a confidence interval based off of a random sample to test that claim. The main way we are going to check the statistical claim is by seeing if the claimed population proportion is within our confidence interval. If it is in our confidence interval, then it is possible that the claim is true. If the claimed value is not in our interval, we may need to investigate further to see if the claim made by an article/study is in fact false.
Example
In our example above dealing with students passing their math class, let's say that we recently read an article that said only 55% of all US students are passing their math class. Therefore, we took a random sample of 85 US math students and we were given the interval above: (0.66125, 0.84463).
Since 0.55 is not in our interval, we have reason to doubt the article that we read. We should definitely investigate it further. ️
Important Note!
When we are given a claim that we are checking, our expected successes and failures change for our Large Counts Condition that we checked in Unit 6.2. Now that we are given a supposed proportion to be true for the population, we use that to calculate our expected successes and failures. So our large counts condition would change to 0.55(85) ≥ 10 & 0.45(85) ≥ 10, which still holds for this particular problem.
In other words, when we are given an actual p to check this condition, use it. When we aren't given a p-value, use the next best thing by using your p-hat.
Sample Size, Confidence Interval Width, Confidence Level, and Margin of Error
- Confidence Interval Width & Sample Size - INVERSE relationship: When all other things remain the same, the width of the confidence interval for a population proportion tends to decrease as the sample size increases. For a population proportion, the width of the interval is proportional to 1/sqrt(n). This is because as the sample size increases, the standard deviation of the sampling distribution decreases, which results in a narrower confidence interval.
- Confidence Interval Width & Confidence Level -- DIRECT relationship: For a given sample, the width of the confidence interval for a population proportion increases as the confidence level increases. This is because a higher confidence level results in a wider confidence interval, as the interval is constructed using a larger critical value.
- Confidence Interval Width & Margin of Error -- 2 x MOE = Width: The width of a confidence interval for a population proportion is exactly twice the margin of error. Recall that width of the interval is calculated by adding and subtracting twice the margin of error to the sample proportion.
Key Terms to Review
- Confidence Interval: A confidence interval is a range of values derived from sample statistics that is likely to contain the true value of an unknown population parameter, with a specified level of confidence. This concept connects statistical inference to the estimation of parameters, allowing researchers to make informed claims about populations based on sample data.
- Critical Value: A critical value is a point on the scale of the test statistic that is compared to the test statistic to determine whether to reject the null hypothesis. It serves as a threshold that defines the boundaries of the rejection region, which helps in assessing whether the observed data falls significantly outside what would be expected under the null hypothesis.
- Expected Successes and Failures: Expected successes and failures refer to the predicted outcomes in a statistical experiment based on the probability of success and the number of trials conducted. This concept is particularly important when assessing claims about population proportions using confidence intervals.
- Large Counts Condition: The Large Counts Condition states that for the sampling distribution of sample proportions to be approximately normal, the counts of successes and failures in a sample must both be large enough, typically at least 10.
- Margin of Error: The margin of error is a statistical term that quantifies the uncertainty associated with a sample estimate, reflecting the range within which the true population parameter is expected to fall.
- P-value (in the context of a given proportion): A p-value is a statistical measure that helps determine the significance of your results in hypothesis testing.
- Random Sample: A random sample is a subset of individuals chosen from a larger population, where each individual has an equal chance of being selected.
- Sample Data: Sample data refers to a subset of individuals or observations selected from a larger population, which is used to make inferences or draw conclusions about that population.
- Sampling Distribution: A sampling distribution is a probability distribution of a statistic obtained by selecting random samples from a population.
- Statistical Claim: A statistical claim is a statement about a population parameter, such as a mean or proportion, that is supported by data and statistical analysis.
- True Population Proportion: The true population proportion refers to the actual fraction of a specific characteristic or attribute present in a population.
- Z*: The term z* represents the critical value of the standard normal distribution that corresponds to a specified confidence level in the context of estimating population proportions.
|
12 videos|106 docs|12 tests
|
FAQs on Justifying a Claim Based on a Confidence Interval for a Population Proportion Chapter Notes - AP Statistics - Grade 9
| 1. What is a confidence interval and why is it important in statistics? |  |
| 2. How do you calculate a confidence interval for a population proportion? | |
| 3. What factors affect the width of a confidence interval? | |
| 4. What is the margin of error in the context of a confidence interval? | |
| 5. How can you justify a claim using a confidence interval? | |


practice quizzes
,Extra Questions
,Free
,Objective type Questions
,past year papers
,Semester Notes
,MCQs
,Important questions
,Viva Questions
,study material
,video lectures
,Summary
,shortcuts and tricks
,Previous Year Questions with Solutions
,Justifying a Claim Based on a Confidence Interval for a Population Proportion Chapter Notes | AP Statistics - Grade 9
,mock tests for examination
,Exam
,Justifying a Claim Based on a Confidence Interval for a Population Proportion Chapter Notes | AP Statistics - Grade 9
,Justifying a Claim Based on a Confidence Interval for a Population Proportion Chapter Notes | AP Statistics - Grade 9
,ppt
,Sample Paper
;


Chapter Notes: Justifying a Claim Based on a Confidence Interval for a Population Proportion Free PDF Download
Importance of Chapter Notes: Justifying a Claim Based on a Confidence Interval for a Population Proportion
Chapter Notes: Justifying a Claim Based on a Confidence Interval for a Population Proportion
Chapter Notes: Justifying a Claim Based on a Confidence Interval for a Population Proportion Grade 9 Questions
Study Chapter Notes: Justifying a Claim Based on a Confidence Interval for a Population Proportion on the App
|
© EduRev
|
Education Revolution
|


|


