Chapter Notes: Setting Up a Test for a Population Proportion

Hypotheses
When it has been identified that we need to perform a one-proportion z-test for a population proportion, the first step we need to do is write out our hypotheses. We have two hypotheses to write: our null hypothesis and our alternative hypothesis.
- Null ("H0"): In a statistical hypothesis test, our null hypothesis is the hypothesis based on our claim that was given in the problem. The null hypothesis is a statement about the population parameter that is being tested. It is the situation that is assumed to be true unless there is evidence to the contrary. The null hypothesis is usually a statement of no difference or no relationship between variables. The null is always written as p = ____.
For example, if the null hypothesis is that the population proportion is 0.5, this means that it is assumed to be true that the population proportion is 0.5 (p = 0.5) unless there is evidence to the contrary. If the sample proportion is significantly different from 0.5, this would provide evidence against the null hypothesis and suggest that the population proportion is not 0.5.
Remember, if our null hypothesis is true, there is no wow factor, nothing new to claim, and essentially, it appears that the original claim was true. - Alternative ("Ha"): Our alternate hypothesis is the hypothesis that the claim in our null is not true. It is always written as either p < ____, p > ____, or p ≠ ____. The alternative hypothesis is usually a statement of difference or relationship between variables. If we are testing that the actual proportion is less than or greater than the claimed proportion, we are doing a one-tailed z-test. If we are testing that the actual proportion is not equal to the claimed proportion, we are doing a two-tailed z-test.
If the evidence supports the alternative hypothesis, the null hypothesis is rejected in favor of the alternative hypothesis. If the evidence does not support the alternative hypothesis, the null hypothesis is not rejected.
Summary:
- For hypotheses about parameters, the null hypothesis contains an equality reference (=, ≥, or ≤), while the alternative hypothesis contains a strict inequality (<,>, or ≠).
- Alternative hypotheses with < or="" /> are called one-sided, and alternative hypotheses with ≠ are called two-sided.
Example
An article recently published in Real News Online! states that 94% of all people can identify the pop culture icon, Baby Yoda. To test this claim, we poll a random sample of 750 people and find that 700 of them can correctly identify Baby Yoda. Do the data give significant evidence that the actual proportion of people who can identify Baby Yoda is more than 94%?
For this question, we are clearly testing a population claim using the sample that we have collected. This calls for a one sample z-test for population proportion (or 1-Prop Z Test). Our first step is to write our hypotheses:
- H0: p = 0.94
- Ha: p > 0.94
Conditions
- Random: As with any hypothesis test or confidence interval, we must have a random sample to perform our test. If we do not have a random sample, we cannot infer anything about the population because our sample might be biased. There is no way to fix sampling bias using mathematical calculations. If our sample is biased, the whole study might as well be thrown out
- Independent: Since we are sampling without replacement, we need to make sure that our population is large enough that our experimental units do not really affect each other after they are selected. To ensure this, we can use the 10% condition, which states that the population should be at least 10 times the size of the sample. We can state: "Since it is reasonable to believe that our population is at least 10n, we can assume our sample is independent."
- Normal: Since we will be using the normal curve to calculate the probability of obtaining our sample, we must first prove that the sampling distribution is normal. For proportions, we will use the Large Counts Condition, which states that the expected numbers of successes and failures are at least 10.
Example: In our example above, we would check the three conditions like this:
- Random: "We poll a random sample of 750 people"
- Independent: It is reasonable to believe that there are at least 7500 people in the world (obviously true!)
- Normal: 750 (0.94) = 658, 750 (0.06) = 45. Both 658 and 45 are more than 10, so we're good.
Calculating Our Necessary Statistics
For actually calculating the values associated with our test, we have to calculate our critical value, and from that, we can calculate our p-value.
Z-Score: The z-score for our data is based on the standard normal curve for our sampling distribution. In other words, we are going to see where our sample falls in the range of all possible samples of size n.
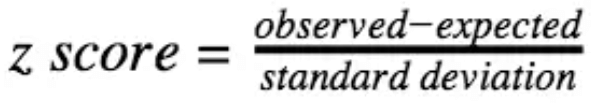
For our example above, our observed value was 0.93333. Our expected value was 0.94.
Our standard deviation is calculated just like that of a sampling distribution:
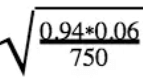
which comes out to be 0.00867.
Putting it all together, our z-score comes out to be -0.769.
P-Value
To calculate our p-value, we are going to use our z-score and see the probability of obtaining that sample by using the standard normal curve and calculating the probability of receiving such a z-score (or higher/lower).
For the example above, we would use our z-score of -0.769 and find the probability of receiving that (or something lower). One way to do this is to use a calculator with the normal cdf function.
Calculating our p-value with this z-score would look like this:
normal cdf(-100000, -0.769, 0, 1) = 0.221.
Using Technology
If this sounds like a lot of work for one problem, you're in luck!
Our graphing calculator will do all of this for us! We just need to go to the Stats Tests Menu and select 1-Prop Z-Test. From there, we simply enter in our parameters, and our calculator will give us a z-score and p-value automatically!
Key Terms to Review
- 1-Prop Z-Test: The 1-Prop Z-Test is a statistical test used to determine if the proportion of a single population is significantly different from a specified value.
- 10% Condition: The 10% Condition is a guideline used in statistics to ensure that the sample size taken from a population is small enough relative to the population size.
- Independent Events: Independent events are two or more events that do not influence each other's occurrence.
- Large Counts Condition: The Large Counts Condition states that the expected counts of successes and failures must both be large enough, typically at least 10.
- Normal cdf Function: The Normal cdf function is a statistical tool used to calculate the cumulative probability of a normal distribution.
- P-value: A P-value is a measure used in hypothesis testing to determine the strength of evidence against the null hypothesis.
- Standard Normal Curve: The Standard Normal Curve is a specific type of normal distribution that has a mean of 0 and a standard deviation of 1.
- Z-Score: A Z-score represents the number of standard deviations a data point is from the mean of a dataset.
FAQs on Chapter Notes: Setting Up a Test for a Population Proportion
| 1. What is a population proportion? |  |
| 2. How do you set up a hypothesis test for a population proportion? | |
| 3. What is the significance level in testing population proportions? | |
| 4. How do you calculate the standard error for a population proportion? | |
| 5. What assumptions must be met when testing a population proportion? | |


