Overview: Slopes Chapter Notes | AP Statistics - Grade 9 PDF Download
| Table of contents |
|
| Recap Time: What is "Inference"? |
|
| Inference |
|
| Scatterplots |
|
| Inference with Scatterplots |
|
| Big Questions in This Unit |
|

In your experience in previous courses, the slope of the line of best fit does not vary for a particular set of bivariate quantitative data. However, suppose every student in a university physics course collects data on spring length for 10 different hanging masses and calculates the least-squares regression line for their sample data. The students’ slopes would likely vary as part of an approximately normal sampling distribution centered at the (true) slope of the population regression line relating spring length to hanging mass.
In this unit, you'll learn how to construct confidence intervals for and perform significance tests about the slope of a population regression line when appropriate conditions are met!
Recap time!
In Unit 3, you were introduced to concepts related to linear regression: slope, y-intercept, R², standard deviation of the residuals (s), and standard error of the slope in context from computer output. We placed huge emphasis on avoiding deterministic language (e.g., “a 1-foot increase in X is associated with a 0.445-point increase in Y”) in favor of framing the association in terms of potential outcomes (i.e., “a predicted 0.445-point increase”). Now, we'll apply what we've learned and connect slopes to inferential statistics!
Recap Time: What is "Inference"?
Remember from Units 6-8 that inference is a huge part of statistics. In fact, it is the most important and useful part of the AP Statistics course (and it's also tested very heavily). Inference is the act of using a sample to either make a prediction or test a claim about a population parameter.
Inference
In Unit 8, we looked at a more complicated way of doing inference for categorical data using inference procedures for categorical data with multiple categories (data presented in a two-way table). In this unit, we will look at a more complex inference procedure for quantitative data by examining bivariate data instead of univariate data. Therefore, our data will be presented in a scatterplot.
Scatterplots
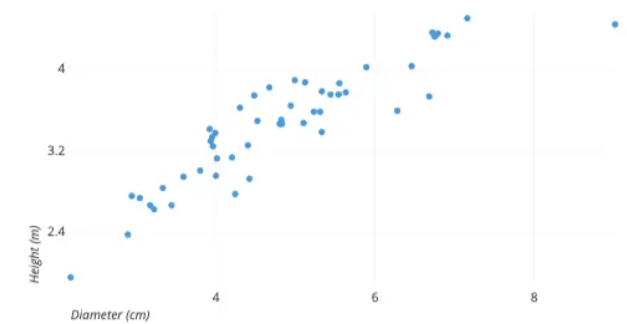
A scatterplot is the most useful way to display bivariate quantitative data. One variable for each data point is displayed on the x-axis and one variable on the y-axis. This often allows us to see correlation or patterns in our data points.
Explanatory Variable
The explanatory variable, or independent variable, is the variable that is typically found along the x-axis. This variable is what does the “explaining” of the patterns we generally see in the overall layout of the scatterplot.
Response Variable
The response variable, or dependent variable, is the variable that is typically found along the y-axis. This variable “responds” to the other variable in building our pattern. It “depends” on the other variable.
Example Variable
For example, if we are investigating the correlation between shoe size and height, we might ask, “Does shoe size depend on height, or does height depend on shoe size?” While either could make sense, it is more reasonable to say that shoe size typically depends on height. Therefore, shoe size is the dependent variable and should be found on the y-axis.
Inference with Scatterplots
As you recall from Unit 2, our linear regression models have several parts: a slope, y-intercept, r value, and R² value. While an r value and R² value help determine how correlated our points are along a scatterplot, they do not provide the inference procedure with hypotheses to indicate evidence of correlation.
This is where our t-interval for slopes and t-test for a slope come in to give us a range of possible values that we can be confident contains the true slope of our regression model!
T-Interval
As with all other units involving inference, the first form of inference procedure we are doing is constructing a confidence interval. A confidence interval allows us to predict the true slope of our regression line. Rather than honing in on one slope, adding a margin of error gives us a range of values that likely contains the true slope of our linear regression model.
T-Test
The other form of inference in scatterplots is a t-test. In this type of inference, we will be testing a null hypothesis that states that the slope between our two variables is 0 (i.e., there is no relation). After running our test, we can determine if there is enough evidence to reject the null hypothesis in favor of another hypothesis (that the slope is not 0).
Big Questions in This Unit
Some questions that you'll be able to answer at the end of Unit 9:
- How can there be variability in slope if the slope statistic is uniquely determined for a line of best fit? The slope is estimated based on sample data, so it can vary from sample to sample.
- When is it appropriate to perform inference about the slope of a population regression line based on sample data? It's appropriate to draw conclusions about the slope when testing for a significant linear relationship between two variables.
- Why do we not conclude that there is no correlation between two variables based on the results of statistical inference for slopes? There could be a nonlinear relationship, or no relationship at all, despite the slope's significance.
Key Terms to Review
- Bivariate Quantitative Data: Data involving two variables measured on a quantitative scale, allowing for analysis of their relationship.
- Categorical Data: Variables divided into distinct groups or categories, essential for analyzing relationships between different groups.
- Confidence Intervals: A range of values estimating a population parameter, indicating uncertainty associated with that estimate.
- Dependent Variable: The outcome measured in a study, which changes in response to the independent variable.
- Deterministic Language: A programming language where outputs are predetermined based on inputs.
- Independent Variable: The factor manipulated in a study to observe effects on the dependent variable.
- Inference: Drawing conclusions about a population based on sample data.
- Least-Squares Regression Line: A method finding the best-fitting line through data points, minimizing the sum of squared distances.
- Linear Regression: A method modeling the relationship between a dependent variable and one or more independent variables.
- Line of Best Fit: A straight line that best represents data points in a scatter plot, showing variable relationships.
- Margin of Error: A statistical term quantifying uncertainty associated with a sample estimate.
- Population Parameter: A numerical value describing a characteristic of an entire population.
- Population Regression Line: Represents the relationship between two quantitative variables in a population.
- Potential Outcomes: Possible results for each individual in a study based on treatment assignment.
- Prediction: Using existing data to make informed guesses about future outcomes.
- Response Variable: The main variable studied to determine relationships with other variables.
- Sampling Distribution: A probability distribution of a statistic obtained by selecting random samples from a population.
- Scatterplot: A graphical representation displaying values for two quantitative variables using dots.
- Significance Tests: Statistical methods determining if observed data significantly deviates from a specific hypothesis.
- Slope: A measure of the steepness of a line, showing how much the dependent variable changes for each unit change in the independent variable.
- Standard Deviation of the Residual (s): Measures the average distance of observed values from the regression line.
- Standard Error of the Slope: Quantifies the accuracy of the estimated slope in a regression model.
- T-interval for slopes: Estimates the range of values likely including the true slope of the population regression line.
- Two-Way Table: Displays the relationship between two categorical variables, allowing for comparison of frequencies.
- Variability: Refers to how spread out values in a dataset are, indicating consistency or inconsistency.
|
12 videos|106 docs|12 tests
|
FAQs on Overview: Slopes Chapter Notes - AP Statistics - Grade 9
| 1. What is a scatterplot and why is it useful in statistics? |  |
| 2. How do we determine which variable is the explanatory variable and which is the response variable in a scatterplot? | |
| 3. What is the purpose of a t-test for the slope in regression analysis? | |
| 4. How can confidence intervals for slopes be interpreted in the context of regression analysis? | |
| 5. Why is it important to understand variability in slope estimates when performing regression analysis? | |


ppt
,Free
,Overview: Slopes Chapter Notes | AP Statistics - Grade 9
,mock tests for examination
,Objective type Questions
,Overview: Slopes Chapter Notes | AP Statistics - Grade 9
,Exam
,Semester Notes
,Sample Paper
,Summary
,study material
,practice quizzes
,shortcuts and tricks
,video lectures
,MCQs
,past year papers
,Extra Questions
,Overview: Slopes Chapter Notes | AP Statistics - Grade 9
,Previous Year Questions with Solutions
,Important questions
,Viva Questions
;


Chapter Notes: Overview: Slopes Free PDF Download
Importance of Chapter Notes: Overview: Slopes
Chapter Notes: Overview: Slopes
Chapter Notes: Overview: Slopes Grade 9 Questions
Study Chapter Notes: Overview: Slopes on the App
|
© EduRev
|
Education Revolution
|


|


