Skills Focus: Selecting an Appropriate Inference Procedure Chapter Notes | AP Statistics - Grade 9 PDF Download

One of the most important skills in AP Statistics is being able to identify the best inference procedure to use in order to complete a hypothesis test or confidence interval. We have covered the following types of procedures:
- One Proportion Z Test
- One Proportion Z Interval
- One Sample T Test
- One Sample T Interval
- Matched Pairs T Test
- Two Proportion Z Test
- Two Proportion Z Interval
- Two Sample T Test
- Two Sample T Interval
- Chi Squared Goodness of Fit Test
- Chi Squared Test for Independence
- Chi Squared Test for Homogeneity
- Linear Regression T Interval
- Linear Regression T Test
For example, if given a problem involving one of the linear regression t procedures, you will often be provided with computer output and be asked to make a conclusion or construct an interval.
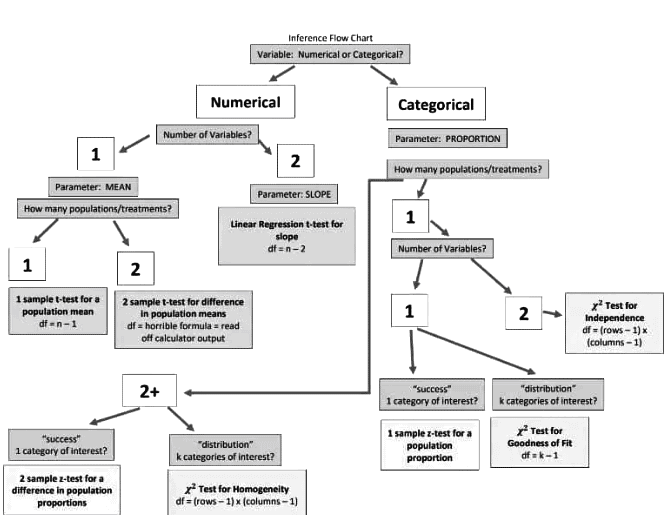
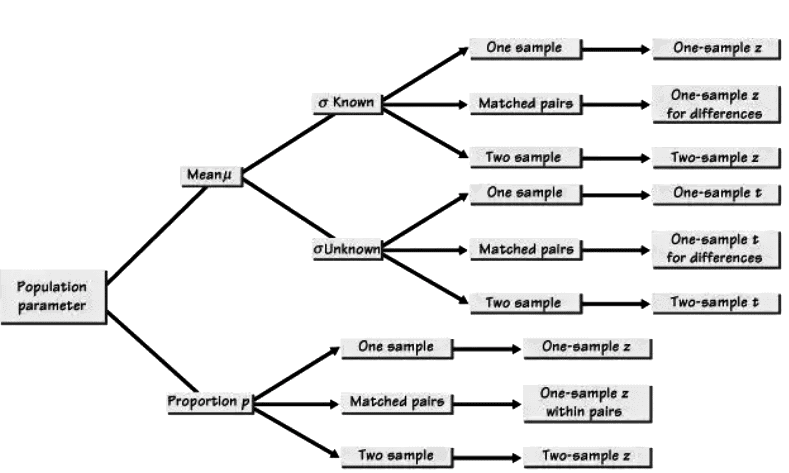
Here are a couple of illustrative flowchart "cheat sheets" on picking the right inferential procedure. Good luck!
Example 1
Here is a computer output similar to what you would see on the AP test. This is based on a study with a sample size of 30.
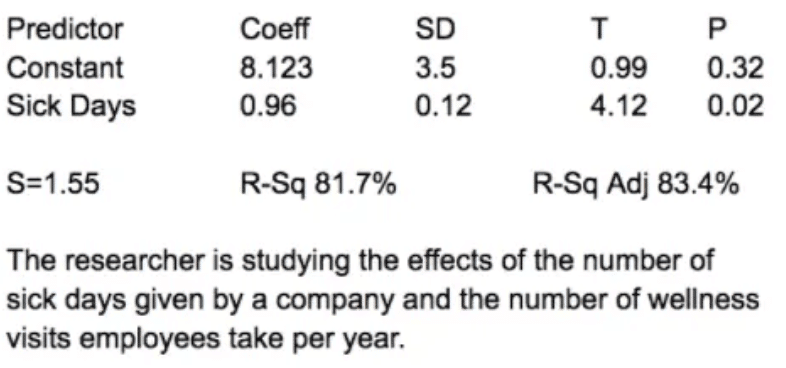
Remember from Unit 2 that we are only focusing on the inference values associated with the slope, which is the row entitled "Sick Days."
Confidence Interval
To construct a confidence interval as discussed in Section 9.2, we will need:
- The point estimate (sample slope)
- The t-score
- The standard error
Everything except our t-score is given in the computer output, so we need to calculate our t-score based on our confidence level and sample size. We first calculate our degrees of freedom (28) and then use that with the invT function to calculate our t-score, yielding a t-score of 2.05 for a 95% confidence level.
For the computer output above, our confidence interval would be:
0.96 ± 2.05(0.12)
This results in the interval (0.714, 1.206). Since 0 is not contained in our interval, there is evidence that the two variables of interest (sick days and wellness visits) are correlated. This is also supported by our high r value, which can be computed from the R² value.
Hypothesis Test
The other option for inference would be to use the p-value to make a judgment on the hypothesis test. In this example, our p-value for the slope is 0.02, which is usually considered significant enough to reject our null hypothesis.
In this instance, our conclusion would be:
- Since our p value 0.02<0.05, we reject the null hypothesis. We have significant evidence that the true slope of the regression model between the number of sick days taken and the number of wellness visits is not 0.
This indicates that these two variables are correlated, supported by the R² and resulting correlation coefficient.
Example 2: Pick a Test!
- A marketing research firm is interested in determining whether the proportion of adults in the United States who use a certain brand of toothpaste is significantly different from 50%. They survey a random sample of 500 adults and find that 270 of them use the toothpaste. Which tests are appropriate?
- A high school statistics teacher wants to determine whether the mean score on a certain statistics exam is significantly different from 80. They administer the exam to a random sample of 25 students and find that the mean score is 78. Which tests are appropriate?
- A psychology researcher is interested in determining whether there is a significant difference in anxiety levels between a treatment group and a control group. They measure anxiety levels in both groups before and after an intervention and find that the mean difference in anxiety levels is -5. Which tests are appropriate?
- A political pollster is interested in determining whether the proportion of registered voters who support a candidate is significantly different from 40%. They survey a random sample of 1000 registered voters and find that 400 of them support the candidate. They also survey a different sample of 1000 voters and find that 300 support the candidate. Which tests are appropriate?
- A nutritionist is interested in determining whether the mean daily caloric intake of a population is significantly different from 2000 calories. They collect data from a random sample of 50 individuals and find that the mean caloric intake is 1950 calories. Which tests are appropriate?
- A historian is interested in determining whether the distribution of birth months among a group of people is significantly different from a uniform distribution. They collect data on the birth months of a random sample of 100 people and find that there are more births in the summer months than in the winter months. Which tests are appropriate?
- A sociologist wants to determine whether there is a significant association between the type of car a person drives and their political party affiliation. They collect data on the car types and political party affiliations of a random sample of 100 people. Which tests are appropriate?
- A medical researcher is interested in determining whether there is a significant difference in the effectiveness of two different treatments for a condition. They randomly assign patients to receive either treatment A or treatment B and measure the percentage of patients showing improvement. Which tests are appropriate?
- A real estate agent is interested in determining whether there is a significant relationship between the size of a house (in square feet) and its sale price. They collect data on the sizes and sale prices of a random sample of houses. Which tests are appropriate?
Answers:
- One Proportion Z-Test, One Proportion Z-Interval
- One Sample T-Test, One Sample T-Interval
- Matched Pairs T-Test
- Two Proportion Z-Test, Two Proportion Z-Interval
- One Sample T-Test, One Sample T-Interval
- Chi Squared Goodness of Fit Test
- Chi-Squared Test for Independence
- Chi-Squared Test for Homogeneity
- Linear Regression T-Test, Linear Regression T-Interval
Key Terms to Review
- Chi-Squared Test for Homogeneity: A statistical method used to determine if two or more populations have the same distribution for a categorical variable.
- Chi-Squared Goodness of Fit Test: A statistical method used to determine if the observed frequencies of categorical data differ significantly from expected frequencies.
- Chi-Squared Test for Independence: A statistical method used to determine whether there is a significant association between two categorical variables.
- Correlation Coefficient: A measure that describes the strength and direction of a relationship between two quantitative variables, ranging from -1 to 1.
- InvT function: A statistical tool used to find the inverse of the Student's t-distribution, particularly useful for critical values in t-tests.
- Matched Pairs T Test: A method used to compare two related samples, focusing on differences between paired observations.
- One Proportion Z Test: A statistical method used to determine whether the proportion of a single sample is significantly different from a known population proportion.
- One Sample T Interval: A method used to estimate the range within which a population mean lies based on a sample mean.
- T-score: A statistic determining how far a sample mean is from the population mean in units of standard error.
- Two Proportion Z Test: A method used to compare the proportions of two independent groups.
- Two Sample T Test: A method used to compare the means of two independent groups.
- Two Proportion Z Interval: A method used to estimate the difference between two population proportions based on sample data.
- Two Sample T Interval: A method used to estimate the difference between the means of two independent groups.
|
12 videos|106 docs|12 tests
|
FAQs on Skills Focus: Selecting an Appropriate Inference Procedure Chapter Notes - AP Statistics - Grade 9
| 1. What is the difference between a confidence interval and a hypothesis test? |  |
| 2. How do I calculate the t-score for a given confidence level? | |
| 3. When should I use a Chi-Squared Test for Independence? | |
| 4. What is the purpose of using a matched pairs t-test? | |
| 5. How can I determine if the proportion of a sample is significantly different from a known population proportion? | |

Skills Focus: Selecting an Appropriate Inference Procedure Chapter Notes | AP Statistics - Grade 9
,Viva Questions
,Extra Questions
,ppt
,Previous Year Questions with Solutions
,Skills Focus: Selecting an Appropriate Inference Procedure Chapter Notes | AP Statistics - Grade 9
,Free
,practice quizzes
,Important questions
,study material
,shortcuts and tricks
,Sample Paper
,Exam
,Skills Focus: Selecting an Appropriate Inference Procedure Chapter Notes | AP Statistics - Grade 9
,past year papers
,mock tests for examination
,Semester Notes
,Objective type Questions
,MCQs
,video lectures
,Summary
;


Chapter Notes: Skills Focus: Selecting an Appropriate Inference Procedure Free PDF Download
Importance of Chapter Notes: Skills Focus: Selecting an Appropriate Inference Procedure
Chapter Notes: Skills Focus: Selecting an Appropriate Inference Procedure
Chapter Notes: Skills Focus: Selecting an Appropriate Inference Procedure Grade 9 Questions
Study Chapter Notes: Skills Focus: Selecting an Appropriate Inference Procedure on the App
|
© EduRev
|
Education Revolution
|


|


