Approximating Values of a Function Using Local Linearity and Linearization Chapter Notes | Calculus AB - Grade 9 PDF Download

Approximating Values of a Function Using Local Linearity and Linear
Picture yourself hiking along a winding mountain trail. At any specific point on this trail, the path may appear relatively straight. This straight path represents your tangent line, which provides a snapshot of the function's behavior at that exact location. In this section, we'll explore how we can utilize this tangent line to approximate values of functions that are not perfectly linear.
Linearization and Tangent Line Approximation
Remember our discussions from Unit 2 regarding the definition of derivatives and tangent lines. At any given point on a curve, the slope of the tangent line is equal to the derivative of the function at that particular point. By using this slope along with the coordinates of the point, you can create an equation for the tangent line using the point-slope formula, which is given as follows:
y−y1 = m(x−x1)
Although you might encounter various formulas for linearization, they fundamentally align with the point-slope formula. If you wish to memorize another formula for the exam, feel free! However, relying on the point-slope formula is a reliable fallback for the AP Exam. Here’s the linearization formula:
L(x) = f(a) + f′(a)(x − a)
Once you have both your x and y coordinates, along with the slope of the tangent line, you are set to approximate values! By substituting the x-value you wish to estimate into your tangent line equation, you can solve for y. This result will provide your approximation. Wasn’t that simple?
Under / Overestimations
On the AP Calculus exam, it's common for questions to ask whether your estimations are greater or less than the actual value. Fortunately, we can determine if our linear approximation is an overestimate or underestimate by examining the function's behavior at the tangent point.
If the graph is concave up at the point of tangency, our linear approximation will be an underestimate. This occurs because the entire tangent line lies below the curve, meaning every value calculated will be less than the actual function value.
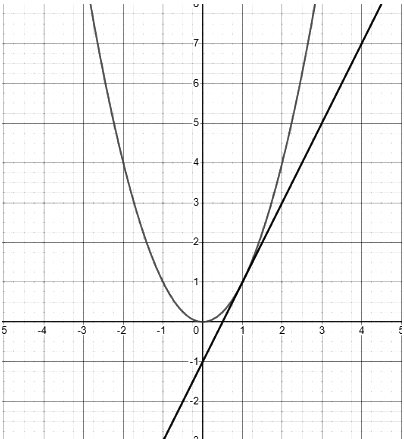
Graph of x2 and corresponding tangent line (y − 1 = 2(x−1). Graph created with Desmos
Conversely, if the graph is concave down at the point of tangency, our linear approximation becomes an overestimate. This is because the tangent line remains above the curve, resulting in every calculated value being greater than the actual function value.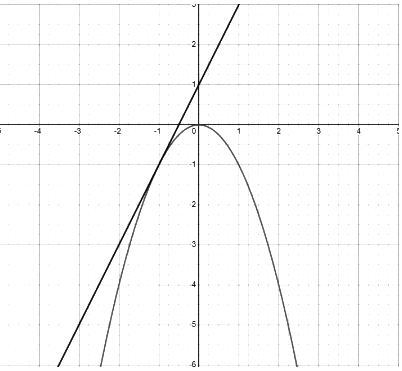 Graph of −x2 and corresponding tangent line (y+1=2(x+1)). Graph created with Desmos
Linearization Practice Questions
The following free-response question (FRQ) is from the 2010 AP Calculus AB examination administered by College Board. All credit to College Board.
Solutions to the differential equation dy/dx = xy3 also satisfy d2y/dx2 = y3(1+3x2y2)). Let y = f(x) be a particular solution to the differential equation dy/dx = xy3 with f(1) = 2.
2010 AP Calculus AB #6a
(a) Write an equation for the line tangent to the graph of
 at
at  .
. To answer this question, we first need to find the slope of the tangent line at the given point
 . Since we have the point (1, 2) provided, we simply substitute this point into the derivative:
f′(1) = (1)(2)3 = 8
Using this information, we can now substitute everything into our point-slope formula to derive the tangent line equation:
y − 2 = 8(x − 1)
2010 AP Calculus AB #6b
(b) Use the tangent line equation from part (a) to approximate
 . Given that
  for
for  , is the approximation for
  greater than or less than
  ? Explain your reasoning.
 Now that we have our tangent line equation, we can use it to estimate a point on our function. By using the equation and substituting in
 , we calculate:
y−2 = 8(1.1−1)
f(1.1) ≈ 2.8
Since we know that for
 , the
, the  , we know that the function is concave up (its second derivative is positive), we conclude that our approximation is an underestimate, as it is lower than the actual function value.
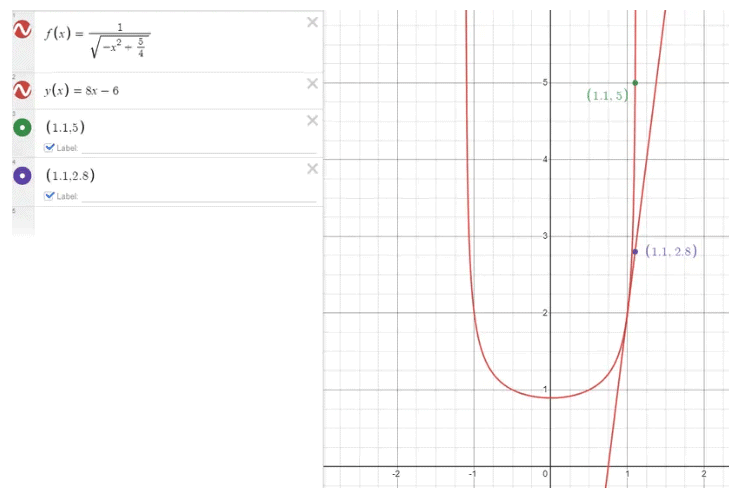
Graph of the function and its tangent line. Graph created with Desmos
Closing
You have now learned how to construct and utilize tangent lines to approximate a point on a function, as well as determine whether this approximation is an overestimate or underestimate. While this skill may seem straightforward compared to others you will learn, it is vital to refine and remember it for the AP exam in May. Enjoy your practice!
Key Terms to Review
- Concave Up: This describes a graph that curves upward, resembling a smiley face. It indicates that the second derivative of the function is positive.
- Concave Down: This describes a graph that curves downward, similar to a frowning face. It indicates that the second derivative of the function is negative.
- Linearization: A method used to estimate function values near a specific point by employing their tangent lines.
- Overestimate: To predict a value that is higher than the actual value, often occurring when we exaggerate or overstate something's significance.
- Point-Slope Form: A way to express the equation of a straight line using the coordinates of a point on the line and its slope, written as y - y₁ = m(x - x₁), where (x₁, y₁) are the coordinates and m is the slope.
- Tangent Line: A straight line that touches a curve at only one point without crossing it. In calculus, tangent lines are used to approximate curves and calculate instantaneous rates of change.
- Underestimate: This refers to making an estimate that is lower than the actual value, occurring when we fail to recognize the true size or significance of something.
|
26 videos|75 docs|38 tests
|
FAQs on Approximating Values of a Function Using Local Linearity and Linearization Chapter Notes - Calculus AB - Grade 9
| 1. What is linearization in calculus? |  |
| 2. How do you determine if a linear approximation is an overestimate or underestimate? | |
| 3. What formula is used to create the equation of a tangent line? | |
| 4. Why is it important to practice linearization for the AP Calculus exam? | |
| 5. Can you provide an example of how to approximate a function value using linearization? | |


video lectures
,mock tests for examination
,Viva Questions
,Approximating Values of a Function Using Local Linearity and Linearization Chapter Notes | Calculus AB - Grade 9
,ppt
,Semester Notes
,Approximating Values of a Function Using Local Linearity and Linearization Chapter Notes | Calculus AB - Grade 9
,Exam
,Objective type Questions
,shortcuts and tricks
,Extra Questions
,Sample Paper
,past year papers
,Important questions
,Approximating Values of a Function Using Local Linearity and Linearization Chapter Notes | Calculus AB - Grade 9
,Free
,MCQs
,practice quizzes
,Summary
,Previous Year Questions with Solutions
,study material
;


Chapter Notes: Approximating Values of a Function Using Local Linearity and Linearization Free PDF Download
Importance of Chapter Notes: Approximating Values of a Function Using Local Linearity and Linearization
Chapter Notes: Approximating Values of a Function Using Local Linearity and Linearization
Chapter Notes: Approximating Values of a Function Using Local Linearity and Linearization Grade 9 Questions
Study Chapter Notes: Approximating Values of a Function Using Local Linearity and Linearization on the App
|
© EduRev
|
Education Revolution
|


|


within 7 days!