CBSE Class 10 > Class 10 Notes > Mathematics (Maths) > Infographics: Statistical Measures
Infographics: Statistical Measures

The document Infographics: Statistical Measures is a part of the Class 10 Course Mathematics (Maths) Class 10.
All you need of Class 10 at this link: Class 10
FAQs on Infographics: Statistical Measures
| 1. What are statistical measures and why are they important? |  |
Ans. Statistical measures are quantitative values that summarize and describe the characteristics of a dataset. They are important because they help in understanding data trends, making comparisons, and informing decisions in various fields like business, healthcare, and social sciences.
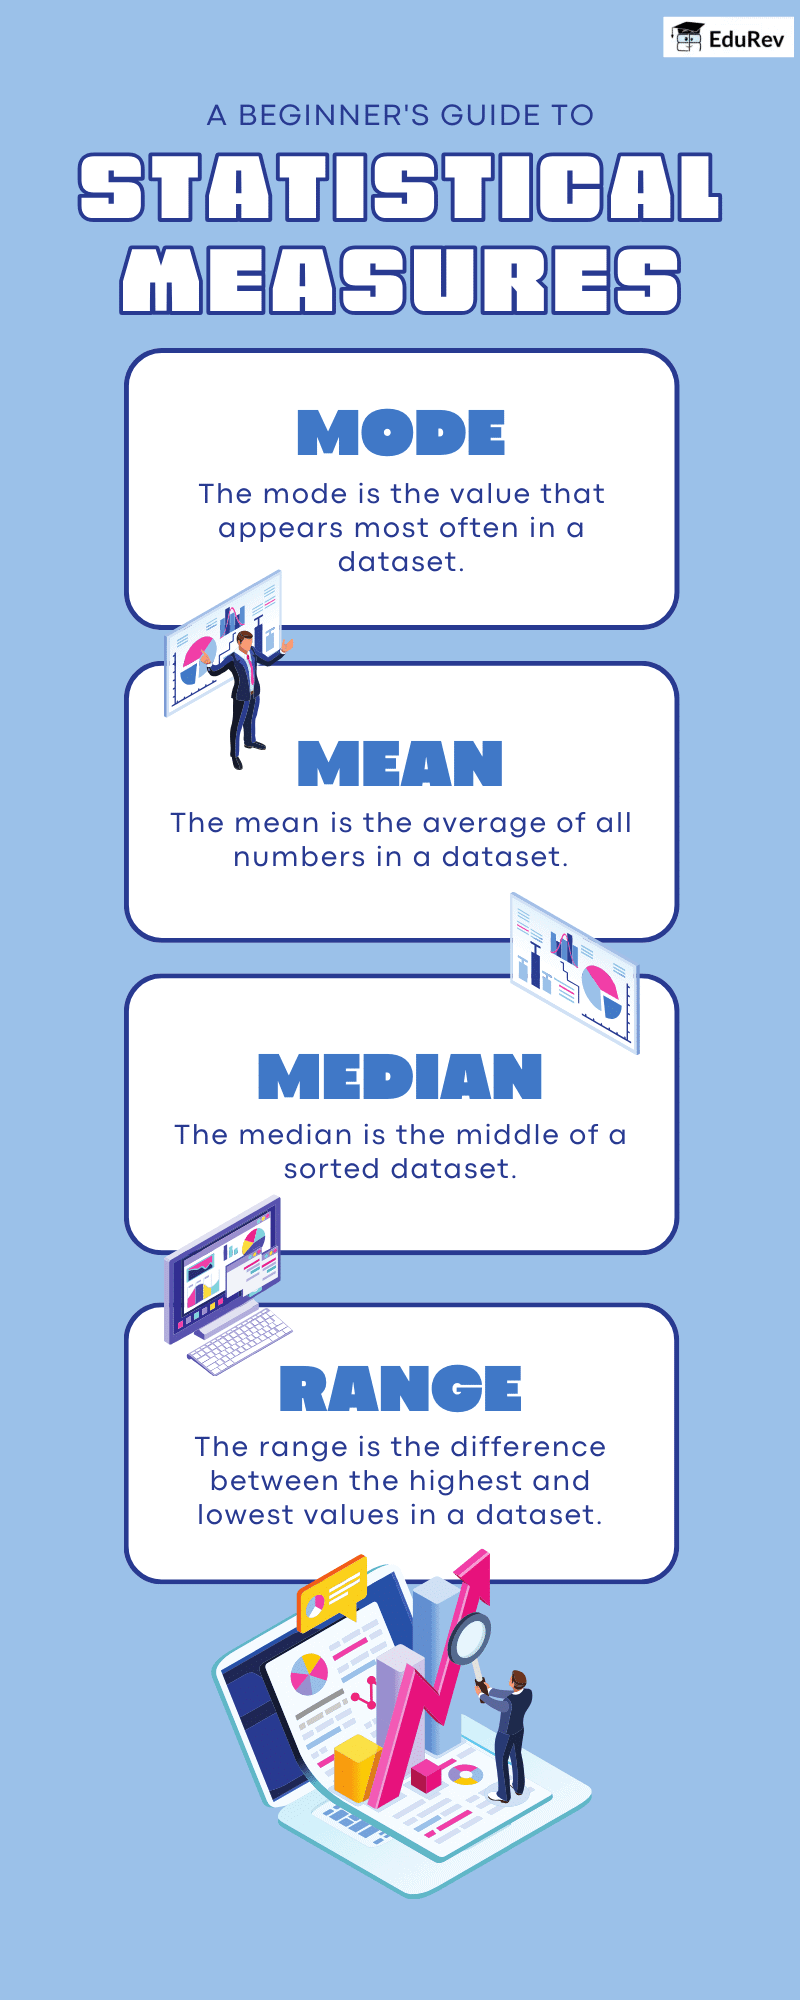
| 2. What is the difference between mean, median, and mode? | |
Ans. The mean is the average of a dataset, calculated by summing all values and dividing by the number of values. The median is the middle value when the data is arranged in ascending order, while the mode is the value that appears most frequently in the dataset. Each measure provides different insights into the data distribution.
| 3. How do you calculate the standard deviation and why is it useful? | |
Ans. Standard deviation measures the amount of variation or dispersion in a dataset. It is calculated by taking the square root of the variance, which is the average of the squared differences from the mean. It is useful because it helps to understand how spread out the values are around the mean, indicating the consistency of the data.
| 4. What is a percentile and how is it used in statistics? | |
Ans. A percentile is a measure that indicates the value below which a given percentage of observations fall in a dataset. For example, the 90th percentile means that 90% of the data points are below this value. Percentiles are used to understand the relative standing of a value within a dataset, commonly used in standardized testing and performance analysis.
| 5. How can outliers affect statistical measures? | |
Ans. Outliers are extreme values that differ significantly from other observations in the dataset. They can skew the results of statistical measures such as the mean, making it misleading. For example, a few high or low outliers can raise or lower the mean, while the median remains unaffected. Identifying and handling outliers is crucial for accurate data analysis.
About this Document

4.93/5 Rating

Apr 29, 2026 Last updated
Document Description: Infographics: Statistical Measures for Class 10 2026 is part of Mathematics (Maths) Class 10 preparation. The notes and questions for Infographics: Statistical Measures have been prepared according to the Class 10 exam syllabus. Information about Infographics: Statistical Measures covers topics like and Infographics: Statistical Measures Example, for Class 10 2026 Exam. Find important definitions, questions, notes, meanings, examples, exercises and tests below for Infographics: Statistical Measures.
Introduction of Infographics: Statistical Measures in English is available as part of our Mathematics (Maths) Class 10 for Class 10 & Infographics: Statistical Measures in Hindi for Mathematics (Maths) Class 10 course. Download more important topics related with notes, lectures and mock test series for Class 10 Exam by signing up for free. Class 10: Infographics: Statistical Measures
Description
Infographics: Statistical Measures of Maths Class 10 provides you one-page visual summary of the chapter covering all the important topics. Download the PDF from EduRev.
Information about Infographics: Statistical Measures
In this doc you can find the meaning of Infographics: Statistical Measures defined & explained in the simplest way possible. Besides explaining types of Infographics: Statistical Measures theory, EduRev gives you an ample number of questions to practice Infographics: Statistical Measures tests, examples and also practice Class 10 tests


Related Searches
Exam, past year papers, Important questions, Objective type Questions, mock tests for examination, Free, Viva Questions, MCQs, Previous Year Questions with Solutions, Infographics: Statistical Measures, study material, pdf , Extra Questions, Summary, ppt, Semester Notes, video lectures, shortcuts and tricks, Infographics: Statistical Measures, Sample Paper, Infographics: Statistical Measures, practice quizzes;