CAT Previous Year Questions: Line Graphs and X-Y Charts | Logical Reasoning (LR) and Data Interpretation (DI) PDF Download

2024
Passage
Answer the following questions based on the information given below.
The air-conditioner (AC) in a large room can be operated either in REGULAR mode or in POWER mode to reduce the temperature.
If the AC operates in REGULAR mode, then it brings down the temperature inside the room (called inside temperature) at a constant rate to the set temperature in 1 hour. If it operates in POWER mode, then this is achieved in 30 minutes.
If the AC is switched off, then the inside temperature rises at a constant rate so as to reach the temperature outside at the time of switching off in 1 hour.
The temperature outside has been falling at a constant rate from 7 pm onward until 3 am on a particular night. The following graph shows the inside temperature between 11 pm (23:00) and 2 am (2:00) that night.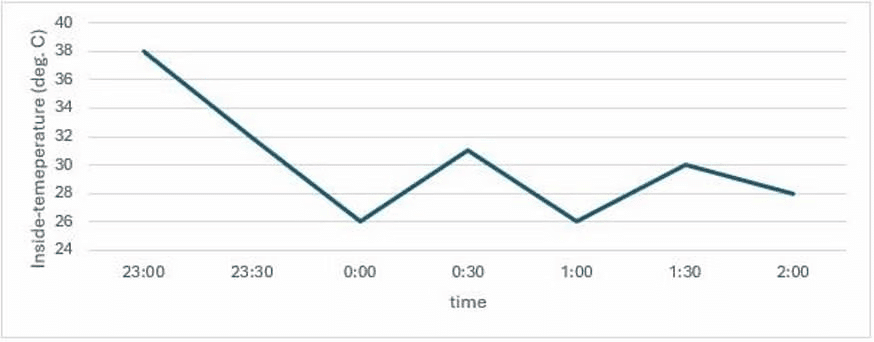
The following facts are known about the AC operation that night.
- The AC was turned on for the first time that night at 11 pm (23:00).
- The AC setting was changed (including turning it on/off, and/or setting different temperatures) only at the beginning of the hour or at 30 minutes after the hour.
- The AC was used in POWER mode for longer duration than in REGULAR mode during this 3-hour period.
Q1: How many times the AC must have been turned off between 11:01 pm and 1:59 am?
(a) Cannot be determined
(b) 2
(c) 0
(d) 1
Ans: b
Sol: Given that the outside temperature is falling at a constant rate, let this be ‘2x’ degrees Celsius per hour. That means it falls by x degree Celsius per half-hour. We can see from the graph that the AC is switched off at exactly 0:00hrs at this time the inside temperature is 26 degrees Celsius. At this time the outside temperature will be 38- 2x degrees. The inside temperature will constantly rise to 38-2x degrees in 1 hour. As we can see from the graph, the inside temperature increased by 5 degrees in half an hour. So, in 1 hour, it will be increased by 10 degrees that is 26+10 = 36 degrees
38 – 2x = 36
2x = 2
x = 1
So, the outside temperature will fall by 1 degree every half-hour.
As we can see from the graph the temperature rises exactly two times, and in the statement it is given, the temperature rises only when the AC is turned off.
Q2: What was the temperature outside, in degree Celsius, at 1 am?
Ans: 34
Sol: Given that the outside temperature is falling at a constant rate, let this be ‘2x’ degrees Celsius per hour. That means it falls by x degree Celsius per half-hour. We can see from the graph that the AC is switched off at exactly 0:00hrs at this time the inside temperature is 26 degrees Celsius. At this time the outside temperature will be 38- 2x degrees. The inside temperature will constantly rise to 38-2x degrees in 1 hour. As we can see from the graph, the inside temperature increased by 5 degrees in half an hour. So, in 1 hour, it will be increased by 10 degrees that is
26+10 = 36 degrees
38 – 2x = 36
2x = 2
x = 1
So, the outside temperature will fall by 1 degree every half-hour.
In two hours the outside temperature will decrease by 4x degrees = 4 degrees.
So, at 1 am the outside temperature is 38 – 4 = 34 degrees.
Q3: What was the temperature outside, in degree Celsius, at 9 pm?
Ans: 42
Sol: Given that the outside temperature is falling at a constant rate, let this be ‘2x’ degrees Celsius per hour. That means it falls by x degree Celsius per half-hour. We can see from the graph that the AC is switched off at exactly 0:00hrs at this time the inside temperature is 26 degrees Celsius. At this time the outside temperature will be 38- 2x degrees. The inside temperature will constantly rise to 38-2x degrees in 1 hour. As we can see from the graph, the inside temperature increased by 5 degrees in half an hour. So, in 1 hour, it will be increased by 10 degrees that is
26+10 = 36 degrees
38 – 2x = 36
2x = 2
x = 1
So, the outside temperature will fall by 1 degree every half-hour.From 9 pm to 23:00 hours or 11:00 pm the outside temperature must have fallen by 4x degrees that is 4 degrees. So, the outside temperature at 9:00 pm is equal to 38 + 4 = 42 degrees.
Q4: What best can be concluded about the number of times the AC must have either been turned on or the AC temperature setting been altered between 11:01 pm and 1:59 am?
(a) Either 2 or 3
(b) More than 3
(c) Exactly 3
(d) Exactly 2
Ans: c
Sol: Given that the outside temperature is falling at a constant rate, let this be ‘2x’ degrees Celsius per hour. That means it falls by x degree Celsius per half-hour. We can see from the graph that the AC is switched off at exactly 0:00hrs at this time the inside temperature is 26 degrees Celsius. At this time the outside temperature will be 38- 2x degrees. The inside temperature will constantly rise to 38-2x degrees in 1 hour. As we can see from the graph, the inside temperature increased by 5 degrees in half an hour. So, in 1 hour, it will be increased by 10 degrees that is 26+10 = 36 degrees
38 – 2x = 36
2x = 2
x = 1
So, the outside temperature will fall by 1 degree every half-hour.
The AC is turned on exactly two times and the temperature is altered exactly once.
Q5: What was the maximum difference between temperature outside and inside temperature, in degree Celsius, between 11:01 pm and 1:59 am?
Ans: 10
Sol: Given that the outside temperature is falling at a constant rate, let this be ‘2x’ degrees Celsius per hour. That means it falls by x degree Celsius per half-hour. We can see from the graph that the AC is switched off at exactly 0:00hrs at this time the inside temperature is 26 degrees Celsius. At this time the outside temperature will be 38- 2x degrees. The inside temperature will constantly rise to 38-2x degrees in 1 hour. As we can see from the graph, the inside temperature increased by 5 degrees in half an hour. So, in 1 hour, it will be increased by 10 degrees that is 26+10 = 36 degrees
38 – 2x = 36
2x = 2
x = 1
So, the outside temperature will fall by 1 degree every half-hour.
The inside temperature is a minimum of 26 degrees, and the outside temperature when the inside temperature is 26 degrees, is 36 and 34 degrees. So, the maximum difference is 36 – 26 = 10 degrees.
2022
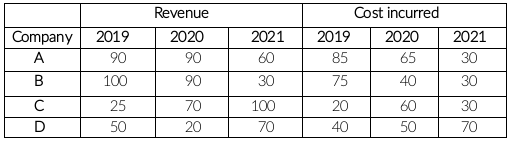
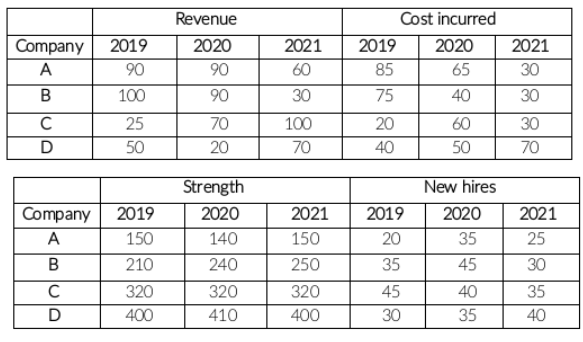
Q1: The two plots below show data for four companies code-named A, B, C, and D over three years - 2019, 2020, and 2021.
The first plot shows the revenues and costs incurred by the companies during these years. For example, in 2021, company C earned Rs.100 crores in revenue and spent Rs.30 crores. The profit of a company is defined as its revenue minus its costs.
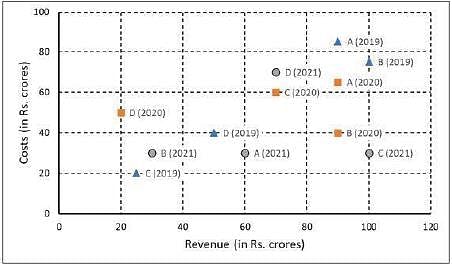
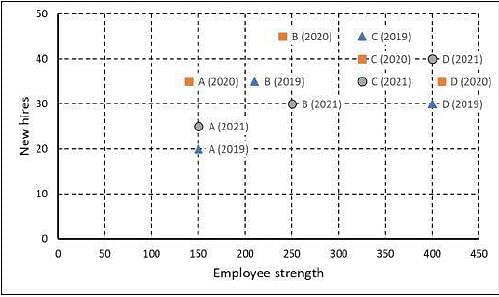
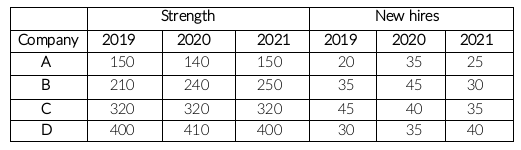
The second plot shows the number of employees employed by the company (employee strength) at the start of each of these three years, as well as the number of new employees hired each year (new hires). For example, Company B had 250 employees at the start of 2021, and 30 new employees joined the company during the year.
Considering all three years, which company had the highest annual profit?
(a) Company B
(b) Company C
(c) Company D
(d) Company A
Ans: b
Sol:
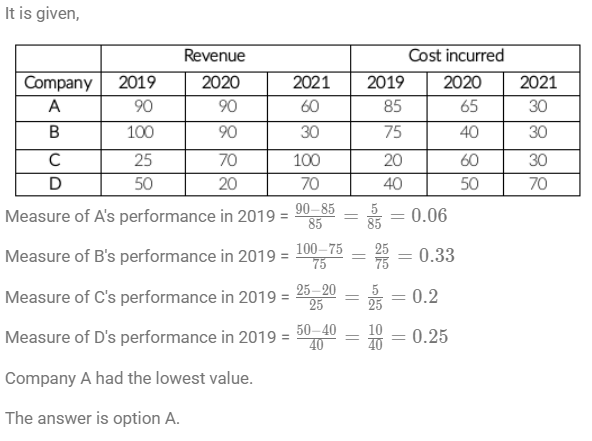
It is given,
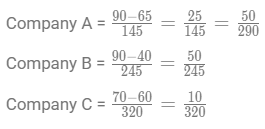
Company A:
Revenue = 240 and cost incurred = 180
Profit = 240 - 180 = 60
Company B:
Revenue = 220 and cost incurred = 145
Profit = 220 - 145 = 75
Company C:
Revenue = 195 and cost incurred = 110
Profit = 195 - 110 = 85
Company D:
Revenue = 140 and cost incurred = 160
No profit.
Company C had the highest annual profit.
Q2: Which of the four companies experienced the highest annual loss in any of the years?
(a) Company B
(b) Company C
(c) Company A
(d) Company D
Ans: d
Sol:
For all the companies in all three years, cost incurred is less than Revenue except for D in 2020.
Revenue is 20 and cost incurred is 50
Company D experienced the highest annual loss in 2020.
The answer is option D.
Q3: The ratio of a company’s annual profit to its annual costs is a measure of its performance. Which of the four companies had the lowest value of this ratio in 2019?
(a) Company D
(b) Company C
(c) Company B
(d) Company A
Ans: d
Sol:
Q4: The total number of employees lost in 2019 and 2020 was the least for:
(a) Company D
(b) Company B
(c) Company A
(d) Company C
Ans: b
Sol:
It is given,
Company A:
The number of employees in the beginning of 2019 = 150
The number of employees hired in 2019 = 20
The number of employees should be at the beginning of 2020 is 150+20, i.e. 170 but there are 140 only. This implies 30 left company A in 2019.
The number of employees in the beginning of 2020 = 140
The number of employees hired in 2020 = 35
The number of employees should be at the beginning of 2021 is 140+35, i.e. 175 but there are 150 only. This implies 25 left company A in 2020.
The number of employees left company A in 2019 and 2020 = 30 + 25 = 55
Company B:
Similarly, the number of employees left company B in 2019 = 210 + 35 - 240 = 5
The number of employees left company B in 2020 = 240 + 45 - 250 = 35
The number of employees left company B in 2019 and 2020 = 5 + 35 = 40
Company C:
Similarly, the number of employees left company C in 2019 = 320 + 45 - 320 = 45
The number of employees left company C in 2020 = 320 + 40 - 320 = 40
The number of employees left company C in 2019 and 2020 = 45 + 40 = 85
Company D:
Similarly, the number of employees left company D in 2019 = 400 + 30 - 410 = 20
The number of employees left company D in 2020 = 410 + 35 - 400 = 45
The number of employees left company D in 2019 and 2020 = 20 + 45 = 65
The total number of employees lost in 2019 and 2020 is least for company B.
Q5: Profit per employee is the ratio of a company’s profit to its employee strength. For this purpose, the employee strength in a year is the average of the employee strength at the beginning of that year and the beginning of the next year. In 2020, which of the four companies had the highest profit per employee?
(a) Company B
(b) Company A
(c) Company C
(d) Company D
Ans: a
Sol: It is given,
Company B had the highest profit per employee.
Q6: In the following, a year corresponds to 1st of January of that year.
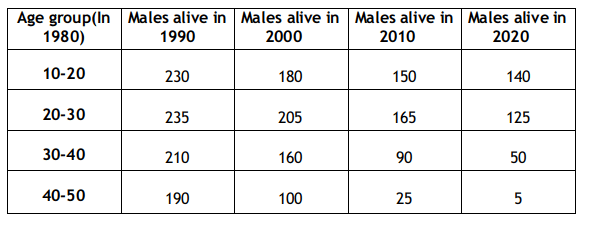
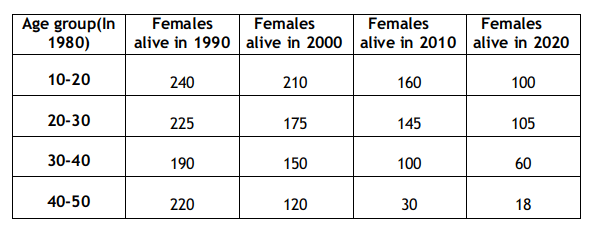
A study to determine the mortality rate for a disease began in 1980. The study chose 1000 males and 1000 females and followed them for forty years or until they died, whichever came first. The 1000 males chosen in 1980 consisted of 250 each of ages 10 to less than 20, 20 to less than 30, 30 to less than 40, and 40 to less than 50. The 1000 females chosen in 1980 also consisted of 250 each of ages 10 to less than 20, 20 to less than 30, 30 to less than 40, and 40 to less than 50.
The four figures below depict the age profile of those among the 2000 individuals who were still alive in 1990, 2000, 2010, and 2020. The blue bars in each figure represent the number of males in each age group at that point in time, while the pink bars represent the number of females in each age group at that point in time. The numbers next to the bars give the exact numbers being represented by the bars. For example, we know that 230 males among those tracked and who were alive in 1990 were aged between 20 and 30.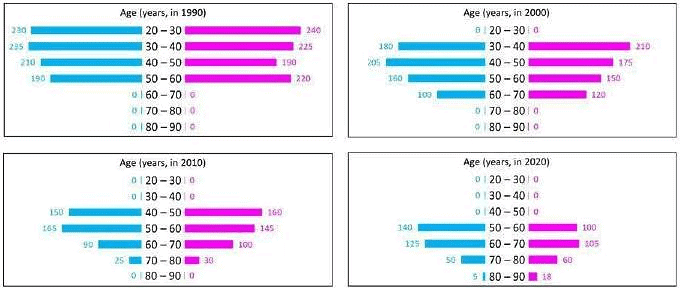
In 2000, what was the ratio of the number of dead males to dead females among those being tracked?
(a) 71 : 69
(b) 41 : 43
(c) 109 : 107
(d) 129 : 131
Ans: a
Sol: The total number of male and female test cases in 1980 = 1000
The total number of males alive in 2000 = 180 + 205 + 160 + 100 = 645
Thus, the number of dead males in 2000 = 1000 - 645 = 355
Similarly, the total number of dead females in 2000 = 1000 - (210 + 175 + 150 + 120) = 1000 - 655 = 345
Thus, the required ratio = 355 : 345 = 71 : 69.
Thus, the correct option is A.
Q7: How many people who were being tracked and who were between 30 and 40 years of age in 1980 survived until 2010?
(a) 310
(b) 110
(c) 190
(d) 90
Ans: c
Sol: The total number of male and female test cases in 1980 = 1000
The total number of males in the age group of 30-40(in 1980) alive till 2010 = 90
The total number of females in the age group of 30-40(in 1980) alive till 2010 = 100
Thus, the total number of people in the age group of 30-40(in 1980) alive till 2010 = 90 + 100 = 190
Thus, the correct option is C.

Q8: How many individuals who were being tracked and who were less than 30 years of age in 1980 survived until 2020?
(a) 230
(b) 240
(c) 470
(d) 580
Ans: c
Sol: The total number of male and female test cases in 1980 = 1000
The total number of males less than 30 years (in 1980) survived until 2020 = 140 + 125 = 265
The total number of females less than 30 years (in 1980) survived until 2020 = 100 + 105 = 205
Thus, The total number of people less than 30 years (in 1980) survived until 2020 = 205 + 265 = 470
Thus, the correct option is C.

Q9: How many of the males who were being tracked and who were between 20 and 30 years of age in 1980 died in the period 2000 to 2010?
Ans: 40
Sol: The total number of male and female test cases in 1980 = 1000
The total number of males between 20 and 30 years of age in 1980 who died in 2000 = 205
The total number of males between 20 and 30 years of age in 1980 who died in 2010 = 165
Thus, the total number of males between 20 and 30 years of age in 1980 who died in the period 2000 to 2010 = 205 - 165 = 40

Q10: How many of the females who were being tracked and who were between 20 and 30 years of age in 1980 died between the ages of 50 and 60?
Ans: 30
Sol: The total number of male and female test cases in 1980 = 1000
We are given that there are 250 females from age 20-30 in 1980 and in 2000 these females age are from 40-50 but only 175 are alive in 2000.
In 2000 there were 175 females from age 40-50. If we assume that out of these, 30 females were of age 48 years in 2000 and they died in 2005, then there are 30 females who died at the age of 53.
If we assume that out of the 175 females, 30 females were of age 42 years in 2000, and they died in 2005, then 30 females died at the age of 47. Now, if we assume that there are 15 females of age 42 and 15 females of age 48 in the year 2000, and they all died in 2005, then we have 15 females who died at the age of 47 and 15 females who died at the age of 53.
So we can see that there are many cases possible. We are given that there were 250 females aged 20-30 in 1980, and in 2010, these females ages are from 50-60, but only 145 are alive in 2010.
In 2010 there were 145 females from age 50-60. If we assume that out of these, 40 females were of age 58 years in 2010 and they died in 2015, then there are 40 females who died at the age of 63.
If we assume that out of the 145 females, 40 females are of age 52 years age in 2010, and they died in 2015, then 40 females died at the age of 57. Now, if we assume that there are 15 females of age 52 and 25 females of age 58 in the year 2010, and they all died in 2015, then we have 15 females who died at the age of 57 and 25 females who died at the age of 63.
So we can see that again, there are many cases possible. In the first case, the range of values possible is from 0 to 30. In the
second case, the range of values possible is from 0 to 40. So in total, we get a range of possible values from 0 to 70.
Thus, only one possible value of this question is not possible.

|
77 videos|180 docs|96 tests
|
FAQs on CAT Previous Year Questions: Line Graphs and X-Y Charts - Logical Reasoning (LR) and Data Interpretation (DI)
| 1. What are line graphs and how are they used in data representation? |  |
| 2. What is the significance of X-Y charts in data analysis? | |
| 3. How can I effectively analyze line graphs in the CAT exam? | |
| 4. What types of questions can I expect related to line graphs and X-Y charts in the CAT exam? | |
| 5. How can I prepare for questions on line graphs and X-Y charts for the CAT exam? | |


past year papers
,Previous Year Questions with Solutions
,Viva Questions
,mock tests for examination
,Summary
,Free
,CAT Previous Year Questions: Line Graphs and X-Y Charts | Logical Reasoning (LR) and Data Interpretation (DI)
,Important questions
,Objective type Questions
,study material
,CAT Previous Year Questions: Line Graphs and X-Y Charts | Logical Reasoning (LR) and Data Interpretation (DI)
,Sample Paper
,ppt
,Extra Questions
,practice quizzes
,shortcuts and tricks
,Exam
,video lectures
,CAT Previous Year Questions: Line Graphs and X-Y Charts | Logical Reasoning (LR) and Data Interpretation (DI)
,Semester Notes
,MCQs
;


CAT Previous Year Questions: Line Graphs and X-Y Charts Free PDF Download
Importance of CAT Previous Year Questions: Line Graphs and X-Y Charts
CAT Previous Year Questions: Line Graphs and X-Y Charts Notes
CAT Previous Year Questions: Line Graphs and X-Y Charts CAT
Study CAT Previous Year Questions: Line Graphs and X-Y Charts on the App
|
© EduRev
|
Education Revolution
|


|


