Chapter Notes: Potential Errors When Performing Tests

What Are Errors in Hypothesis Testing?
Even with meticulous planning, precise calculations, and adherence to proper procedures, errors can occur in statistical tests. These errors don't necessarily stem from mistakes in sampling or calculations but rather from the inherent randomness in sampling that can lead to misleading results. Fortunately, there are strategies to minimize these risks, ensuring more reliable outcomes.
In inferential statistics, two primary errors can occur during hypothesis testing: Type I and Type II errors. Let's explore each in detail.
Type I Error (False Positive)
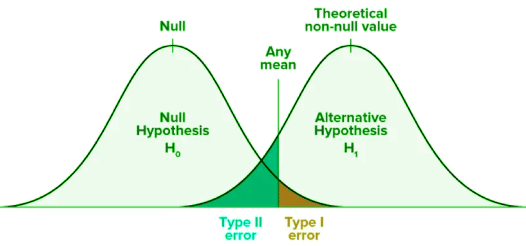
A Type I error happens when we incorrectly reject a true null hypothesis. This is often called a "false positive" because we conclude there's an effect or difference when there isn't one. This error typically occurs when a low p-value misleads us into thinking we've drawn a rare sample, prompting an incorrect rejection of the null hypothesis. The probability of a Type I error is denoted by the significance level (α), commonly set at 0.05 or 0.01 to keep this risk low.
Type II Error (False Negative)
A Type II error occurs when we fail to reject a false null hypothesis, meaning we miss detecting a real effect or difference. Known as a "false negative," this happens when the p-value isn't low enough to reject the null hypothesis, even though the alternative hypothesis is true. The probability of a Type II error is denoted by β. A significance level of 0.05 often strikes a balance, minimizing Type II errors while maintaining statistical significance.
Memory Tip: Type I error probability is α (alpha), and Type II error probability is β (beta).
Factors Reducing Type II Errors
The likelihood of a Type II error decreases when:
- The sample size increases.
- The significance level (α) increases.
- The standard error decreases.
- The true parameter value is further from the null hypothesis value.
Power of a Statistical Test
The power of a test is the probability of correctly rejecting a false null hypothesis, essentially the test's ability to detect a true effect. Power is the complement of β (i.e., 1 - β), meaning a higher power reduces the chance of a Type II error. To boost power:
- Increase the sample size, as larger samples provide estimates closer to the true population parameter.
- Use a less stringent significance level (e.g., α = 0.05 instead of 0.01), though this increases the risk of a Type I error.
A significance level of 0.05 is often a practical compromise, balancing the risks of both error types while preserving the test's reliability. 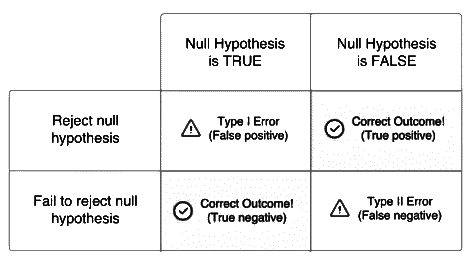
AP Statistics Test Pointers
AP Statistics exams frequently test your understanding of errors and power. Here are common question types and how to approach them:
- Identify the Error: You'll need to describe Type I or Type II errors in the context of a given problem. Memorize their definitions (Type I: rejecting a true null; Type II: failing to reject a false null) and apply them to the scenario.
- Consequences of Errors: Be prepared to explain the real-world impact of making a Type I or Type II error in the context of the problem. For example, what happens if a true null hypothesis is wrongly rejected?
- Increasing Power: Questions often ask how to increase a test's power. The answer is consistently to increase the sample size, as this improves the test's ability to detect true effects.
Example: Library Reading Goals Study

A researcher is studying whether 85% of people are satisfied with their personal reading goals. Suspecting this proportion is lower and that a new library could help, the researcher tests:
- Null Hypothesis (H₀): p = 0.85 (85% are satisfied).
- Alternative Hypothesis (Hₐ): p < 0.85 (fewer than 85% are satisfied).
(a) Describe a Type II Error and Its Consequence
A Type II error occurs if the researcher fails to reject H₀ when it's false. In this case, they'd conclude there's no evidence that fewer than 85% of people are satisfied with their reading goals, when in reality, the proportion is lower. A consequence is that the community might not get a new library, leaving many dissatisfied with their reading progress.
(b) How to Increase the Power of This Test?
To increase the test's power and reduce the chance of a Type II error, the researcher should increase the sample size. A larger sample provides a more accurate estimate of the true proportion, improving the test's ability to detect a real difference.
Key Terms to Review
- Alternative Hypothesis: A statement suggesting an effect, difference, or relationship exists, opposing the null hypothesis.
- Hypothesis Test: A statistical method to draw conclusions about a population using sample data, involving null and alternative hypotheses.
- Null Hypothesis: A statement assuming no effect or difference, serving as the baseline for testing.
- P-value: A measure of evidence against the null hypothesis, indicating the probability of observing results as extreme as those obtained if the null is true.
- Power of the Test: The probability of correctly rejecting a false null hypothesis, influenced by sample size, effect size, and significance level.
- Sample Size: The number of observations in a sample, critical for result reliability and test power.
- Significance Level (α): The threshold for rejecting the null hypothesis, representing the probability of a Type I error.
- Standard Error: A measure of how much a sample mean varies from the population mean, used in confidence intervals and hypothesis tests.
- Type I Error: Incorrectly rejecting a true null hypothesis (false positive).
- Type II Error: Failing to reject a false null hypothesis (false negative).
FAQs on Chapter Notes: Potential Errors When Performing Tests
| 1. What are the two main types of errors in hypothesis testing? |  |
| 2. How can the probability of a Type I error be controlled in hypothesis testing? | |
| 3. What factors can influence the likelihood of a Type II error in hypothesis testing? | |
| 4. Why is it important to understand Type I and Type II errors when conducting research? | |
| 5. How can researchers minimize both Type I and Type II errors in their studies? | |


