Setting Up a Test for the Difference of Two Population Proportions Chapter Notes | AP Statistics - Grade 9 PDF Download

One effective method to evaluate a statistical claim is to conduct a hypothesis test for the difference between two population proportions. This process involves formulating hypotheses, verifying necessary conditions, performing calculations, and drawing conclusions. Let’s dive into the details!
Overview of Significance Testing
A significance test helps determine whether the observed difference between two population proportions is statistically meaningful or simply due to random chance. This test is critical in fields like social sciences, healthcare, and marketing to validate claims about group differences.
Steps for Conducting the Test
To perform a significance test for the difference in two population proportions, follow these steps:
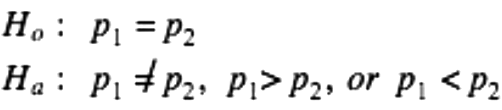
- Write Hypotheses: Define the null hypothesis (H₀), which assumes the two population proportions are equal (p₁ = p₂), and the alternative hypothesis (Hₐ), which posits a difference (p₁ ≠ p₂, p₁ > p₂, or p₁ < p₂).
- Check Conditions: Ensure the sample meets specific criteria for valid inference.
- Calculate the Test Statistic: Compute the test statistic and find the p-value.
- Draw Conclusions: Compare the p-value to the significance level (typically 0.05). If the p-value is less than 0.05, reject H₀, indicating a significant difference. Otherwise, fail to reject H₀, suggesting the difference is not statistically significant.
Defining Hypotheses and Parameters
The first step is to establish the null and alternative hypotheses. The null hypothesis always assumes that the proportions of the two populations are equal (H₀: p₁ = p₂). The alternative hypothesis can vary, stating that one proportion is greater, less than, or not equal to the other
 It’s crucial to clearly define what p₁ and p₂ represent. Use descriptive subscripts (e.g., p_MJ for Michael Jordan’s shooting proportion) to clarify the populations being compared.
Conditions for Inference
Before proceeding with calculations, verify the following conditions to ensure the test’s validity:
- Random Sampling: Both samples must be randomly selected to avoid sampling bias, which could prevent generalizing results to the population.
- Independence: Each population should be at least 10 times larger than its respective sample. For randomized experiments, random assignment of treatments ensures independence.
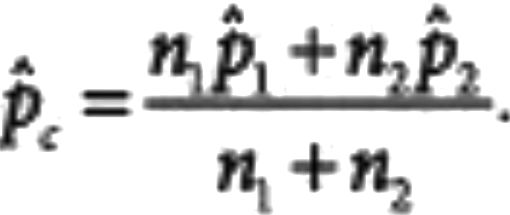
- Normal Approximation: The Large Counts Condition requires that the expected number of successes and failures in each sample is at least 10. For a two-proportion z-test, calculate a pooled proportion (p̂_combined) from the combined samples to check this condition.
Then we have to verify that each of our expected failures and successes are at least 10. This is because we are using a pooled sample. In this test, you combine the two samples into a single "pooled" sample and calculate a single proportion for the combined sample. The test statistic is then calculated based on the difference between the two proportions and the pooled sample proportion.
Example: Comparing Basketball Shooting Proportions
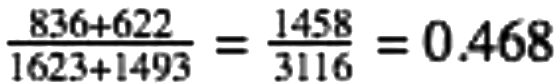
Let’s revisit the comparison of Michael Jordan (MJ) and LeBron James’ shooting success rates. MJ made 836 out of 1623 shots, and LeBron made 622 out of 1493 shots. We’ll use a two-proportion z-test to determine if there’s a significant difference in their shooting proportions.
Hypotheses and Parameters
H0 : PMJ = PL
Ha : PMJ > PL
Where PMJ is the true proportion of shots MJ made and PL is the true proportion of shots Lebron made.
Another great idea when writing our hypotheses is to use meaningful subscripts such as MJ and L that clarify which proportion matches which population.
Conditions
- Random: Although not explicitly stated, we assume the samples are random for this example.
- Independence: MJ’s 1623 shots are less than 10% of his career shots (assumed >16,230), and LeBron’s 1493 shots are less than 10% of his career shots (assumed >14,930), confirming independence.
- Normal: This is the one that will be a bit different. First, we have to calculate our pooled p-hat. Using the formula above, we get 0.468
Next, we have to check our large counts condition using this pooled p-hat.
- 1623 (0.468) > 10
- 1623 (0.532) > 10
- 1493 (0.468) > 10
- 1493 (0.532) > 10
Now that we have checked conditions, we are ready to calculate and test our claim.
Key Terms
- 2 Proportion Z Test: A statistical test to compare the proportions of two independent populations, using a z-score to assess whether observed differences are due to chance.
- Alternative Hypothesis: A statement suggesting a difference or effect exists, opposing the null hypothesis.
- Confidence Interval: A range estimating a population parameter with a specified confidence level, based on sample data.
- Independent Sample: Samples from two populations that do not influence each other, ensuring unbiased comparisons.
- Large Counts Condition: Requires at least 10 expected successes and failures to ensure the sampling distribution is approximately normal.
- P-value: The probability of observing results as extreme as those obtained, assuming the null hypothesis is true.
- Pooled Sample: Combines data from two samples to estimate a common proportion, enhancing statistical inference.
- Random Sample: A subset where each individual has an equal chance of selection, reducing bias.
- Sample Size: The number of observations in a sample, affecting the precision of statistical estimates.
- Sampling Bias: Occurs when a sample is not representative, skewing results and limiting generalizability.
- Significance Test: A method to evaluate evidence against the null hypothesis using sample data and p-values.
- Significance Level: The threshold (e.g., α = 0.05) for rejecting the null hypothesis, representing the risk of a Type I error.
|
12 videos|106 docs|12 tests
|
FAQs on Setting Up a Test for the Difference of Two Population Proportions Chapter Notes - AP Statistics - Grade 9
| 1. What is the purpose of comparing basketball shooting proportions in statistical analysis? |  |
| 2. What are the conditions for inference when comparing two population proportions? | |
| 3. How do you set up a test for the difference of two population proportions? | |
| 4. What is the significance level, and how does it affect the results of the test? | |
| 5. How can the results of the basketball shooting proportions test be interpreted in practical terms? | |


Extra Questions
,Summary
,MCQs
,shortcuts and tricks
,study material
,practice quizzes
,video lectures
,Free
,Setting Up a Test for the Difference of Two Population Proportions Chapter Notes | AP Statistics - Grade 9
,past year papers
,Exam
,ppt
,Previous Year Questions with Solutions
,Important questions
,Setting Up a Test for the Difference of Two Population Proportions Chapter Notes | AP Statistics - Grade 9
,Sample Paper
,Semester Notes
,mock tests for examination
,Setting Up a Test for the Difference of Two Population Proportions Chapter Notes | AP Statistics - Grade 9
,Objective type Questions
,Viva Questions
;


Chapter Notes: Setting Up a Test for the Difference of Two Population Proportions Free PDF Download
Importance of Chapter Notes: Setting Up a Test for the Difference of Two Population Proportions
Chapter Notes: Setting Up a Test for the Difference of Two Population Proportions
Chapter Notes: Setting Up a Test for the Difference of Two Population Proportions Grade 9 Questions
Study Chapter Notes: Setting Up a Test for the Difference of Two Population Proportions on the App
|
© EduRev
|
Education Revolution
|


|


