Setting Up a Test for a Population Mean Chapter Notes | AP Statistics - Grade 9 PDF Download
| Table of contents |
|
| Introduction to Statistical Significance Tests |
|
| Significance Level (α) |
|
| Writing Hypotheses |
|
| Checking Conditions for Inference |
|

Introduction to Statistical Significance Tests
When analyzing a claim from a study or article, the first step is to identify whether a statistical significance test is needed. Look for phrases like "Do the data provide strong evidence..." or "Is there convincing evidence that..." These indicate a hypothesis test is required.
Next, determine the data type. If the data is quantitative, a test for a population mean is appropriate, typically using a one-sample t-test when working with a single sample and an unknown population standard deviation (σ). This test relies on t-scores, similar to confidence intervals.
One-Sample T-Test Overview
A one-sample t-test compares a sample's mean to a hypothesized population mean. It's used when the population standard deviation is unknown. The process involves defining two hypotheses:
- Null Hypothesis (H₀): Assumes no difference or effect, typically written as μ = μ₀, where μ is the population mean and μ₀ is the hypothesized value.
- Alternative Hypothesis (Hₐ): Suggests a difference, written as μ ≠ μ₀, μ < μ₀, or μ > μ₀, depending on the research question.
Significance Level (α)
The significance level, denoted as α, represents the probability of rejecting the null hypothesis when it’s true (Type I error). Common values, like 0.05 (5% risk), balance the risk of false positives (Type I errors) and false negatives (Type II errors). A lower α reduces false positives but increases false negatives, while a higher α does the opposite. The choice of α depends on the research context.
If the p-value from the test is less than α, reject the null hypothesis, indicating the sample mean significantly differs from the hypothesized mean.
Connection to Confidence Intervals
The significance level is linked to confidence intervals. For example, a significance level of 0.05 corresponds to a 95% confidence interval. A significance level of 0.02 aligns with a 98% confidence interval. The complement of the significance level (1 − α) matches the confidence level of the corresponding interval.
In a 95% confidence interval, the rejection region (where the null hypothesis is rejected) lies outside the interval, typically in the tails of the distribution. For instance, with a mean of 0 and 29 degrees of freedom, sample statistics beyond ±2.04 fall in the rejection region, suggesting the population mean differs from the claimed value.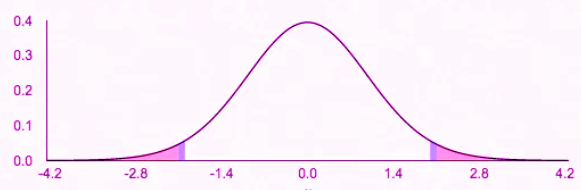
Writing Hypotheses
Null Hypothesis (H₀)
The null hypothesis states the population mean equals the hypothesized value (μ = μ₀). For example, if a study claims the average number of chicken nuggets per bag is 20, the null hypothesis is μ = 20. The test evaluates whether the sample mean significantly deviates from this value. If the p-value is less than α (e.g., 0.05), reject H₀; otherwise, accept the claim.
Alternative Hypothesis (Hₐ)
The alternative hypothesis opposes the null, taking one of three forms:
- μ ≠ μ₀ (two-tailed test, indicating the mean differs)
- μ < μ₀ (one-tailed test, indicating the mean is less)
- μ > μ₀ (one-tailed test, indicating the mean is greater)
The choice depends on the research question. For example, if testing whether the mean number of chicken nuggets exceeds 20, use Hₐ: μ > 20.
Example
A study claims high school seniors miss an average of 5.2 school days. A random sample of 150 seniors shows an average of 4.1 days missed with a standard deviation of 0.4. Is there evidence that the true mean is less than 5.2 days?
- H₀: μ = 5.2 (the mean number of days missed is 5.2)
- Hₐ: μ < 5.2 (the mean number of days missed is less than 5.2)
The alternative hypothesis reflects the question’s focus on whether the mean is lower than the claimed value.
Checking Conditions for Inference
Before conducting a one-sample t-test, verify three conditions to ensure valid results:
- Random: The sample must be randomly selected to represent the population. Non-random samples invalidate inferences about the population.
- Independent: Since sampling is typically without replacement, true independence isn’t achieved. However, if the population is at least 10 times larger than the sample, the effect is negligible. State: “It is reasonable to believe there are at least [10 × sample size] [population context].”
- Normal:The sampling distribution must be approximately normal. Verify this using one of these methods (in order of preference):
- Central Limit Theorem: If the sample size is ≥30, the distribution is approximately normal.
- Population Normality: If the population is known to be approximately normal.
- Sample Data Check: Create a modified box plot to confirm the sample data is symmetric with no outliers or gaps.
Key Terms
- Alternative Hypothesis: A statement opposing the null hypothesis, indicating an effect or difference exists.
- Central Limit Theorem: States that the sampling distribution of the sample mean becomes normal as sample size increases, enabling inferences regardless of population distribution.
- Confidence Interval: A range likely containing the true population parameter with a specified confidence level.
- Hypothesized Population Mean: The proposed population mean used in hypothesis testing, serving as the null hypothesis benchmark.
- Null Hypothesis: Assumes no effect or difference, forming the basis for statistical testing.
- One-Sample T-Test: Compares a sample mean to a hypothesized population mean when the population standard deviation is unknown.
- Population Mean: The average of all values in a population, central to hypothesis testing.
- Random Independent Normal Conditions: Requirements ensuring unbiased, independent, and normally distributed sample data for valid hypothesis testing.
- Rejection Region: The range of values leading to null hypothesis rejection, based on the significance level.
- Significance Level (α): The threshold for rejecting the null hypothesis, representing the Type I error probability.
- Standard Deviation (σ): Measures data variability, critical for hypothesis testing and confidence intervals.
- Statistical Significance Test: Evaluates whether observed data reflects true effects or random chance.
- T-Scores: Standardized scores used in t-tests to assess how far a sample mean is from the hypothesized mean.
- Type II Error: Failing to reject a false null hypothesis, missing a true effect or difference.
|
12 videos|106 docs|12 tests
|
FAQs on Setting Up a Test for a Population Mean Chapter Notes - AP Statistics - Grade 9
| 1. What is the significance level (α) in statistical tests? |  |
| 2. How do I write null and alternative hypotheses for a test? | |
| 3. What conditions need to be checked before performing a significance test? | |
| 4. What is the purpose of performing a significance test on a population mean? | |
| 5. How do I interpret the results of a significance test? | |


Sample Paper
,Previous Year Questions with Solutions
,Summary
,shortcuts and tricks
,Setting Up a Test for a Population Mean Chapter Notes | AP Statistics - Grade 9
,ppt
,practice quizzes
,video lectures
,Free
,Semester Notes
,study material
,Objective type Questions
,Exam
,mock tests for examination
,Viva Questions
,Setting Up a Test for a Population Mean Chapter Notes | AP Statistics - Grade 9
,Setting Up a Test for a Population Mean Chapter Notes | AP Statistics - Grade 9
,Extra Questions
,MCQs
,past year papers
,Important questions
;


Chapter Notes: Setting Up a Test for a Population Mean Free PDF Download
Importance of Chapter Notes: Setting Up a Test for a Population Mean
Chapter Notes: Setting Up a Test for a Population Mean
Chapter Notes: Setting Up a Test for a Population Mean Grade 9 Questions
Study Chapter Notes: Setting Up a Test for a Population Mean on the App
|
© EduRev
|
Education Revolution
|


|


