Grade 9 Exam > Grade 9 Notes > AP Statistics > Chapter Notes: Skills Focus: Selecting, Implementing, and Communicating Inference Procedures
Skills Focus: Selecting, Implementing, and Communicating Inference Procedures Chapter Notes | AP Statistics - Grade 9 PDF Download

Multiple Choice
Multiple choice questions on inferential procedures typically focus on three areas: choosing the appropriate statistical method, interpreting p-values, or making conclusions based on p-values.
Selecting the Right Procedure
To choose the correct inferential procedure, ask yourself two key questions:
- Am I analyzing means (using t-tests) or proportions (using z-tests)?
- Does the problem involve one sample or two samples?
These questions guide you to the appropriate test or interval, such as a one-sample t-test, two-sample z-test, or confidence interval.
Special Cases
- Matched Pairs t-Test (Dependent Samples t-Test): Used to compare means of two related groups, where each subject in one group is paired with a subject in the other (e.g., same subjects receiving two treatments, like a drug and placebo). The test examines differences within pairs.
- Two-Sample t-Test: Compares means of two independent groups (e.g., men vs. women). Ensure you don’t confuse this with a matched pairs t-test, as the groups are unrelated.
- Multiple Proportions: When comparing more than two proportions, a chi-square test may be appropriate. This test compares observed frequencies to expected frequencies in a contingency table, often used to analyze relationships between categorical variables.
Interpreting P-Values
A p-value represents the probability of observing your sample data (or more extreme results) assuming the null hypothesis is true, given the sample size and sampling distribution.
Example:
In a hypothesis test where the H0: p = 0.2 and the Ha: p < 0.2, we collect a sample of 100 where our p-hat is 0.15. Our significance test reveals a p-value of 0.11. Interpret this p-value.
Interpretation: There is an 11% chance of obtaining a sample proportion of 0.15 or lower in a sample of 100, assuming the true population proportion is 0.2.
Drawing Conclusions
Compare the p-value to the significance level (\( \alpha \)) to draw conclusions:
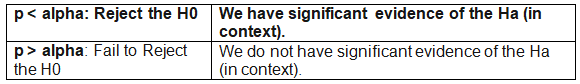
We never "accept" a H0 or Ha!
Free Response Questions
Free response questions typically involve one of two tasks:
- Significance Test: Determine if the data provide convincing evidence for a claim.
- Confidence Interval: Construct and interpret a confidence interval with a specified confidence level.
Both tasks can follow the SPDC Template:
- State Parameters/Hypotheses:
- For confidence intervals, define the population parameter(s) being estimated.
- When performing a significance test, this is the place in the problem when you should write the hypotheses for your questions. Also, label and identify your parameters.- Remember, your Ho will always have an equal sign and your Ha will always have some form of inequality (<, > or not equal to)
- Plan the Problem: Verify three conditions for inference:
- Random: Data must come from a random sample.
- Independent: Observations or samples are independent.
- Normal: The sampling distribution should be approximately normal (varies by data type—categorical or quantitative).
- Do the Math:
- Identify the test or interval (e.g., one-sample t-test, z-interval Tell me about statistical inference procedures, focusing on selecting, implementing, and communicating them effectively. Provide detailed notes in HTML format for my blog, ensuring all key information is included and paraphrased for uniqueness.
- Below are comprehensive notes in HTML format, crafted for inclusion on your blog. They cover the selection, implementation, and communication of statistical inference procedures, paraphrased to ensure originality while preserving all essential details from the provided information
Question for Chapter Notes: Skills Focus: Selecting, Implementing, and Communicating Inference ProceduresTry yourself: What does a p-value represent in hypothesis testing?View Solution
- Key Terms to Understand
- Alternative Hypothesis (Ha): Suggests a significant effect or difference, opposing the null hypothesis. It guides the test’s direction (one- or two-tailed) and is key in tests like chi-square for categorical data relationships.
- Categorical Data: Variables grouped into distinct categories (e.g., gender, color), used to analyze group relationships and proportions.
- Chi-Square Test: Tests associations between categorical variables or compares observed and expected distributions, useful for survey and experimental data.
- Confidence Interval: A range likely containing the true population parameter, with a specified confidence level, aiding in population estimates.
- Contingency Table: Displays frequency distributions of categorical variables to reveal relationships and patterns.
- Critical Value: A threshold on the test statistic scale used to decide whether to reject the null hypothesis, defining the rejection region.
- Dependent Samples t-Test: Compares means of two related groups (e.g., same subjects under different conditions) to assess treatment effects.
- Hypothesis Test: A method to infer population characteristics from sample data, testing null versus alternative hypotheses for data-driven decisions.
- Independent Events: Events where one’s outcome does not affect another, critical for many statistical calculations.
- Inferential Procedures: Methods to generalize about populations from samples, including hypothesis testing and parameter estimation.
- Matched Pairs t-Test: Compares means of paired groups (e.g., before-and-after measurements), focusing on within-pair differences.
- Normal Distribution: A symmetric, bell-shaped probability distribution central to many statistical tests assuming normality.
- Null Hypothesis (H0): Assumes no significant effect or difference, serving as the baseline for statistical testing.
- P-Value: A P-value is a measure used in hypothesis testing to determine the strength of evidence against the null hypothesis. It quantifies the probability of observing test results at least as extreme as the ones obtained, assuming that the null hypothesis is true. A smaller P-value indicates stronger evidence against the null hypothesis, which is crucial for decision-making in various statistical tests.
- Random Sampling: Selecting individuals where each has an equal chance, ensuring representative samples and reducing bias.
- Significance Level: The threshold for rejecting the null hypothesis, representing the risk of a Type I error.
- T-Test: Tests for significant differences between means or regression slopes, ideal for small samples with unknown variances.
- Two-Sample t-Test: Compares means of two independent groups, assuming normal distributions and similar variances.
- Z-Test: Tests differences between means or a sample mean and a known population mean, using the standard normal distribution, suitable for large samples or known variances.
The document Skills Focus: Selecting, Implementing, and Communicating Inference Procedures Chapter Notes | AP Statistics - Grade 9 is a part of the Grade 9 Course AP Statistics.
All you need of Grade 9 at this link: Grade 9
|
12 videos|106 docs|12 tests
|
FAQs on Skills Focus: Selecting, Implementing, and Communicating Inference Procedures Chapter Notes - AP Statistics - Grade 9
| 1. What are inference procedures in statistics? |  |
Ans. Inference procedures are statistical methods used to make conclusions or predictions about a population based on sample data. They help us understand trends, relationships, and the likelihood of outcomes, applying techniques such as hypothesis testing, confidence intervals, and regression analysis.
| 2. How do I select the appropriate inference procedure for my data? | |
Ans. To select the appropriate inference procedure, consider the following factors: the type of data (categorical or numerical), the sample size, the distribution of the data (normal or non-normal), and the research question being asked. Common procedures include t-tests for comparing means and chi-square tests for categorical data.
| 3. What is the importance of communicating inference results effectively? | |
Ans. Communicating inference results is crucial because it ensures that the findings are understood by the intended audience. Effective communication helps to clarify the implications of the results, informs decision-making, and allows for proper interpretation of statistical significance and confidence levels.
| 4. What steps are involved in implementing an inference procedure? | |
Ans. Implementing an inference procedure typically involves the following steps: defining the research question, selecting the appropriate procedure, collecting and preparing the data, performing the analysis, interpreting the results, and communicating the findings clearly to stakeholders.
| 5. How can I improve my skills in selecting and implementing inference procedures? | |
Ans. To improve your skills, engage in practical exercises using real datasets, take online courses or workshops focused on statistics, read relevant literature, and practice interpreting results. Additionally, collaborating with peers or mentors in statistical analysis can provide valuable insights and feedback.
About this Document

Oct 11, 2025
Last updated
Related Exams
Document Description: Chapter Notes: Skills Focus: Selecting, Implementing, and Communicating Inference Procedures for Grade 9 2025 is part of AP Statistics preparation.
The notes and questions for Chapter Notes: Skills Focus: Selecting, Implementing, and Communicating Inference Procedures have been prepared according to the Grade 9 exam syllabus. Information about Chapter Notes: Skills Focus: Selecting, Implementing, and Communicating Inference Procedures covers topics
like Multiple Choice, Free Response Questions and Chapter Notes: Skills Focus: Selecting, Implementing, and Communicating Inference Procedures Example, for Grade 9 2025 Exam. Find important definitions, questions, notes, meanings, examples, exercises and tests below for Chapter Notes: Skills Focus: Selecting, Implementing, and Communicating Inference Procedures.
Introduction of Chapter Notes: Skills Focus: Selecting, Implementing, and Communicating Inference Procedures in English is available as part of our AP Statistics
for Grade 9 & Chapter Notes: Skills Focus: Selecting, Implementing, and Communicating Inference Procedures in Hindi for AP Statistics course.
Download more important topics related with notes, lectures and mock test series for Grade 9
Exam by signing up for free. Grade 9: Skills Focus: Selecting, Implementing, and Communicating Inference Procedures Chapter Notes | AP Statistics - Grade 9
Description
Full syllabus notes, lecture & questions for Skills Focus: Selecting, Implementing, and Communicating Inference Procedures Chapter Notes | AP Statistics - Grade 9 - Grade 9 | Plus excerises question with solution to help you revise complete syllabus for AP Statistics | Best notes, free PDF download
Information about Chapter Notes: Skills Focus: Selecting, Implementing, and Communicating Inference Procedures
In this doc you can find the meaning of Chapter Notes: Skills Focus: Selecting, Implementing, and Communicating Inference Procedures defined & explained in the simplest way possible. Besides explaining types of
Chapter Notes: Skills Focus: Selecting, Implementing, and Communicating Inference Procedures theory, EduRev gives you an ample number of questions to practice Chapter Notes: Skills Focus: Selecting, Implementing, and Communicating Inference Procedures tests, examples and also practice Grade 9
tests

Related Searches
Implementing
,Implementing
,Exam
,Skills Focus: Selecting
,Important questions
,Implementing
,study material
,and Communicating Inference Procedures Chapter Notes | AP Statistics - Grade 9
,practice quizzes
,Extra Questions
,past year papers
,and Communicating Inference Procedures Chapter Notes | AP Statistics - Grade 9
,ppt
,Semester Notes
,mock tests for examination
,Previous Year Questions with Solutions
,shortcuts and tricks
,Summary
,Skills Focus: Selecting
,Objective type Questions
,MCQs
,Viva Questions
,Skills Focus: Selecting
,Sample Paper
,and Communicating Inference Procedures Chapter Notes | AP Statistics - Grade 9
,Free
,video lectures
;


Additional Information about Chapter Notes: Skills Focus: Selecting, Implementing, and Communicating Inference Procedures for Grade 9 Preparation
Chapter Notes: Skills Focus: Selecting, Implementing, and Communicating Inference Procedures Free PDF Download
The Chapter Notes: Skills Focus: Selecting, Implementing, and Communicating Inference Procedures is an invaluable resource that delves deep into the core of the Grade 9 exam.
These study notes are curated by experts and cover all the essential topics and concepts, making your preparation more efficient and effective.
With the help of these notes, you can grasp complex subjects quickly, revise important points easily,
and reinforce your understanding of key concepts. The study notes are presented in a concise and easy-to-understand manner,
allowing you to optimize your learning process. Whether you're looking for best-recommended books, sample papers, study material,
or toppers' notes, this PDF has got you covered. Download the Chapter Notes: Skills Focus: Selecting, Implementing, and Communicating Inference Procedures now and kickstart your journey towards success in the Grade 9 exam.
Importance of Chapter Notes: Skills Focus: Selecting, Implementing, and Communicating Inference Procedures
The importance of Chapter Notes: Skills Focus: Selecting, Implementing, and Communicating Inference Procedures cannot be overstated, especially for Grade 9 aspirants.
This document holds the key to success in the Grade 9 exam.
It offers a detailed understanding of the concept, providing invaluable insights into the topic.
By knowing the concepts well in advance, students can plan their preparation effectively.
Utilize this indispensable guide for a well-rounded preparation and achieve your desired results.
Chapter Notes: Skills Focus: Selecting, Implementing, and Communicating Inference Procedures
Chapter Notes: Skills Focus: Selecting, Implementing, and Communicating Inference Procedures Notes offer in-depth insights into the specific topic to help you master it with ease.
This comprehensive document covers all aspects related to Chapter Notes: Skills Focus: Selecting, Implementing, and Communicating Inference Procedures.
It includes detailed information about the exam syllabus, recommended books, and study materials for a well-rounded preparation.
Practice papers and question papers enable you to assess your progress effectively.
Additionally, the paper analysis provides valuable tips for tackling the exam strategically.
Access to Toppers' notes gives you an edge in understanding complex concepts.
Whether you're a beginner or aiming for advanced proficiency, Chapter Notes: Skills Focus: Selecting, Implementing, and Communicating Inference Procedures Notes on EduRev are your ultimate resource for success.
Chapter Notes: Skills Focus: Selecting, Implementing, and Communicating Inference Procedures Grade 9 Questions
The "Chapter Notes: Skills Focus: Selecting, Implementing, and Communicating Inference Procedures Grade 9 Questions" guide is a valuable resource for all aspiring students preparing for the
Grade 9 exam. It focuses on providing a wide range of practice questions to help students gauge
their understanding of the exam topics. These questions cover the entire syllabus, ensuring comprehensive preparation.
The guide includes previous years' question papers for students to familiarize themselves with the exam's format and difficulty level.
Additionally, it offers subject-specific question banks, allowing students to focus on weak areas and improve their performance.
Study Chapter Notes: Skills Focus: Selecting, Implementing, and Communicating Inference Procedures on the App
Students of Grade 9 can study Chapter Notes: Skills Focus: Selecting, Implementing, and Communicating Inference Procedures alongwith tests & analysis from the EduRev app,
which will help them while preparing for their exam. Apart from the Chapter Notes: Skills Focus: Selecting, Implementing, and Communicating Inference Procedures,
students can also utilize the EduRev App for other study materials such as previous year question papers, syllabus, important questions, etc.
The EduRev App will make your learning easier as you can access it from anywhere you want.
The content of Chapter Notes: Skills Focus: Selecting, Implementing, and Communicating Inference Procedures is prepared as per the latest Grade 9 syllabus.
|
© EduRev
|
Education Revolution
|


|


Signup on EduRev and stay on top of your study goals
10M+ students crushing their study goals daily