Grade 9 Exam > Grade 9 Notes > AP Statistics > Chapter Notes: Carrying Out a Test for the Slope of a Regression Model
Carrying Out a Test for the Slope of a Regression Model Chapter Notes | AP Statistics - Grade 9 PDF Download

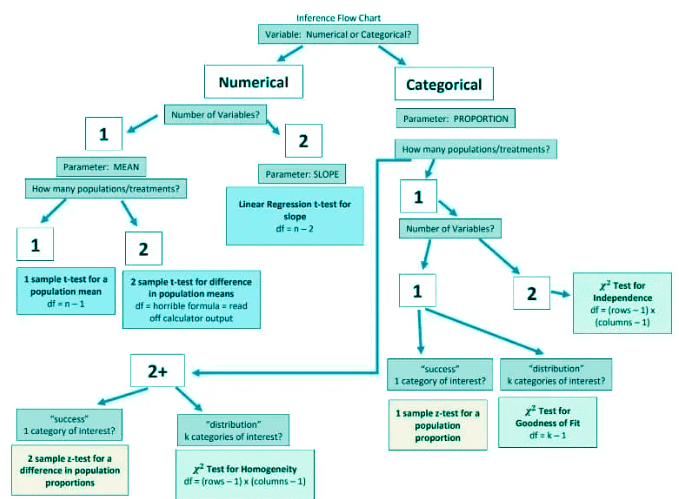
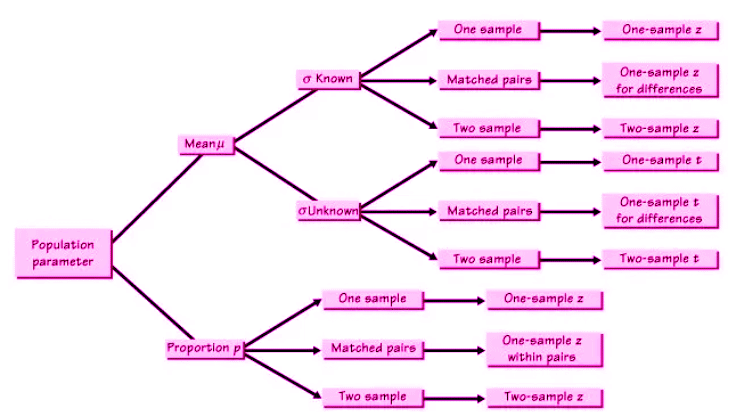
In AP Statistics, one of the most critical skills is selecting the correct inference procedure for conducting hypothesis tests or constructing confidence intervals. Below is a detailed guide to the inference procedures covered in the course, along with examples and key terms to help you master this skill.
Inference Procedures Overview
The following procedures are commonly used in AP Statistics for hypothesis testing and confidence intervals:
- One Proportion Z Test
- One Proportion Z Interval
- One Sample T Test
- One Sample T Interval
- Matched Pairs T Test
- Two Proportion Z Test
- Two Proportion Z Interval
- Two Sample T Test
- Two Sample T Interval
- Chi-Squared Goodness of Fit Test
- Chi-Squared Test for Independence
- Chi-Squared Test for Homogeneity
- Linear Regression T Test
- Linear Regression T Interval
For linear regression procedures, you’ll often work with computer output to draw conclusions or calculate intervals, particularly focusing on the slope of the regression line.
Illustrative Examples
Example 1: Linear Regression Analysis
Consider a study with a sample size of 30 examining the relationship between sick days and wellness visits. The computer output provides key values for constructing a confidence interval or conducting a hypothesis test, focusing on the slope (labeled “Sick Days”).
Confidence Interval
To create a 95% confidence interval for the slope, you need the sample slope (point estimate), standard error, and t-score. The computer output provides the sample slope (0.96) and standard error (0.12). To find the t-score, calculate the degrees of freedom (n - 2 = 30 - 2 = 28) and use the invT function for a 95% confidence level, yielding a t-score of 2.05.
The confidence interval is calculated as:
0.96 ± 2.05 × 0.12 = (0.714, 1.206)
Since the interval (0.714, 1.206) does not include 0, we conclude there is evidence of a correlation between sick days and wellness visits. This is further supported by a high R² value, indicating a strong linear relationship.
Hypothesis Test
For a hypothesis test, the computer output provides a p-value of 0.02 for the slope. Since 0.02 < 0.05, we reject the null hypothesis, concluding there is significant evidence that the true slope of the regression line between sick days and wellness visits is not zero, indicating a correlation. This is consistent with the high R² value and correlation coefficient.
Example 2: Selecting the Appropriate Test
Below are scenarios requiring you to choose the correct inference procedure:
- Scenario: A marketing firm surveys 500 adults to determine if the proportion using a specific toothpaste brand differs significantly from 50%, with 270 users identified.
Appropriate Tests: One Proportion Z Test, One Proportion Z Interval - Scenario: A statistics teacher tests 25 students and finds a mean exam score of 78, wanting to know if it differs significantly from 80.
Appropriate Tests: One Sample T Test, One Sample T Interval - Scenario: A researcher measures anxiety levels before and after an intervention in treatment and control groups, finding a mean difference of -5.
Appropriate Test: Matched Pairs T Test - Scenario: A pollster surveys 1000 voters in two regions, finding 400 and 300 supporting a candidate, respectively, to compare support against 40%.
Appropriate Tests: Two Proportion Z Test, Two Proportion Z Interval - Scenario: A nutritionist finds a mean caloric intake of 1950 calories in a sample of 50, testing if it differs from 2000 calories.
Appropriate Tests: Two Sample T Test, Two Sample T Interval - Scenario: A historian examines birth months of 100 people, noting more summer births, to test against a uniform distribution.
Appropriate Test: Chi-Squared Goodness of Fit Test - Scenario: A sociologist studies car types and political affiliations in 100 people, noting more Democrats drive sedans.
Appropriate Test: Chi-Squared Test for Independence - Scenario: A researcher compares improvement rates between two treatments, finding treatment A more effective.
Appropriate Test: Chi-Squared Test for Homogeneity - Scenario: A real estate agent finds a positive relationship between house size and sale price in a sample.
Appropriate Tests: Linear Regression T Test, Linear Regression T Interval.
Question for Chapter Notes: Carrying Out a Test for the Slope of a Regression ModelTry yourself: What is the purpose of the One Proportion Z Test in AP Statistics?View Solution
Key Terms
- Chi-Squared Test for Homogeneity: This test evaluates whether multiple populations share the same distribution for a categorical variable, comparing observed and expected frequencies in a contingency table to assess if differences are significant.
- Chi-Squared Goodness of Fit Test: Used to determine if observed categorical data frequencies significantly differ from expected frequencies, this test checks if a sample distribution matches a theoretical one.
- Chi-Squared Test for Independence: This test assesses whether two categorical variables are associated by examining if the distribution of one varies across the categories of the other in a contingency table.
- Correlation Coefficient: A measure from -1 to 1 indicating the strength and direction of a linear relationship between two quantitative variables, with 0 indicating no correlation.
- InvT Function: A tool for finding critical values in the t-distribution, used in t-tests and confidence intervals when the population standard deviation is unknown or sample sizes are small.
- Matched Pairs T Test: Compares means of paired observations (e.g., before and after measurements) to determine if there is a significant difference, often used in case-control or repeated-measures studies.
- One Proportion Z Test: Tests whether a sample proportion significantly differs from a known population proportion, useful for categorical data hypothesis testing.
- One Sample T Interval: Estimates a population mean’s range based on a sample mean, using the t-distribution for small samples or unknown population standard deviations.
- T-Score: Measures how far a sample mean is from the population mean in standard error units, critical for hypothesis testing with small samples.
- Two Proportion Z Test: Compares proportions from two independent groups to determine if they significantly differ, using normal approximation for binomial data.
- Two Sample T Test: Compares means of two independent groups to assess if their population means differ significantly, used in experimental or survey data analysis.
- Two Proportion Z Interval: Estimates the difference between two population proportions, providing a confidence interval for the true difference based on sample data.
- Two Sample T Interval: Estimates the difference between means of two independent groups, using the t-distribution to account for variability and small sample sizes.
The document Carrying Out a Test for the Slope of a Regression Model Chapter Notes | AP Statistics - Grade 9 is a part of the Grade 9 Course AP Statistics.
All you need of Grade 9 at this link: Grade 9
|
12 videos|106 docs|12 tests
|
FAQs on Carrying Out a Test for the Slope of a Regression Model Chapter Notes - AP Statistics - Grade 9
| 1. What is the purpose of hypothesis testing in the context of regression analysis? |  |
Ans.Hypothesis testing in regression analysis is used to determine whether there is a statistically significant relationship between the independent variable(s) and the dependent variable. Specifically, it helps assess the validity of the null hypothesis, which typically states that the slope of the regression line is equal to zero (no effect). By testing this hypothesis, researchers can conclude whether the independent variable significantly predicts the dependent variable.
| 2. How do you interpret the slope of a regression model? | |
Ans.The slope of a regression model represents the change in the dependent variable for each one-unit increase in the independent variable. If the slope is positive, it indicates a direct relationship, meaning that as the independent variable increases, the dependent variable also increases. Conversely, a negative slope indicates an inverse relationship, where an increase in the independent variable leads to a decrease in the dependent variable.
| 3. What are the assumptions underlying regression analysis? | |
Ans.The assumptions underlying regression analysis include linearity, independence, homoscedasticity, normality of errors, and no multicollinearity among independent variables. These assumptions ensure that the results of the regression analysis are valid and reliable. If these assumptions are violated, it may affect the accuracy of the model and the conclusions drawn from it.
| 4. What is the significance of the p-value in testing the slope of a regression model? | |
Ans.The p-value in testing the slope of a regression model indicates the probability of observing the data, or something more extreme, if the null hypothesis is true. A small p-value (typically less than 0.05) suggests that there is strong evidence against the null hypothesis, leading to its rejection. This indicates that the slope is statistically significant, meaning the independent variable has a significant effect on the dependent variable.
| 5. How can one check the goodness of fit of a regression model? | |
Ans.Goodness of fit can be assessed using several measures, with the most common being R-squared (R²). R² indicates the proportion of variance in the dependent variable that is explained by the independent variable(s) in the model. A higher R² value (closer to 1) suggests a better fit, meaning the model explains a large portion of the variability. Other methods include examining residual plots and conducting F-tests to assess the overall significance of the model.
About this Document

Oct 11, 2025
Last updated
Related Exams
Document Description: Chapter Notes: Carrying Out a Test for the Slope of a Regression Model for Grade 9 2025 is part of AP Statistics preparation.
The notes and questions for Chapter Notes: Carrying Out a Test for the Slope of a Regression Model have been prepared according to the Grade 9 exam syllabus. Information about Chapter Notes: Carrying Out a Test for the Slope of a Regression Model covers topics
like Inference Procedures Overview, Illustrative Examples and Chapter Notes: Carrying Out a Test for the Slope of a Regression Model Example, for Grade 9 2025 Exam. Find important definitions, questions, notes, meanings, examples, exercises and tests below for Chapter Notes: Carrying Out a Test for the Slope of a Regression Model.
Introduction of Chapter Notes: Carrying Out a Test for the Slope of a Regression Model in English is available as part of our AP Statistics
for Grade 9 & Chapter Notes: Carrying Out a Test for the Slope of a Regression Model in Hindi for AP Statistics course.
Download more important topics related with notes, lectures and mock test series for Grade 9
Exam by signing up for free. Grade 9: Carrying Out a Test for the Slope of a Regression Model Chapter Notes | AP Statistics - Grade 9
Description
Full syllabus notes, lecture & questions for Carrying Out a Test for the Slope of a Regression Model Chapter Notes | AP Statistics - Grade 9 - Grade 9 | Plus excerises question with solution to help you revise complete syllabus for AP Statistics | Best notes, free PDF download
Information about Chapter Notes: Carrying Out a Test for the Slope of a Regression Model
In this doc you can find the meaning of Chapter Notes: Carrying Out a Test for the Slope of a Regression Model defined & explained in the simplest way possible. Besides explaining types of
Chapter Notes: Carrying Out a Test for the Slope of a Regression Model theory, EduRev gives you an ample number of questions to practice Chapter Notes: Carrying Out a Test for the Slope of a Regression Model tests, examples and also practice Grade 9
tests

Related Searches
Important questions
,study material
,Sample Paper
,practice quizzes
,Carrying Out a Test for the Slope of a Regression Model Chapter Notes | AP Statistics - Grade 9
,Extra Questions
,Summary
,Carrying Out a Test for the Slope of a Regression Model Chapter Notes | AP Statistics - Grade 9
,Objective type Questions
,Viva Questions
,MCQs
,Previous Year Questions with Solutions
,mock tests for examination
,video lectures
,Free
,Exam
,shortcuts and tricks
,ppt
,Semester Notes
,Carrying Out a Test for the Slope of a Regression Model Chapter Notes | AP Statistics - Grade 9
,past year papers
;


Additional Information about Chapter Notes: Carrying Out a Test for the Slope of a Regression Model for Grade 9 Preparation
Chapter Notes: Carrying Out a Test for the Slope of a Regression Model Free PDF Download
The Chapter Notes: Carrying Out a Test for the Slope of a Regression Model is an invaluable resource that delves deep into the core of the Grade 9 exam.
These study notes are curated by experts and cover all the essential topics and concepts, making your preparation more efficient and effective.
With the help of these notes, you can grasp complex subjects quickly, revise important points easily,
and reinforce your understanding of key concepts. The study notes are presented in a concise and easy-to-understand manner,
allowing you to optimize your learning process. Whether you're looking for best-recommended books, sample papers, study material,
or toppers' notes, this PDF has got you covered. Download the Chapter Notes: Carrying Out a Test for the Slope of a Regression Model now and kickstart your journey towards success in the Grade 9 exam.
Importance of Chapter Notes: Carrying Out a Test for the Slope of a Regression Model
The importance of Chapter Notes: Carrying Out a Test for the Slope of a Regression Model cannot be overstated, especially for Grade 9 aspirants.
This document holds the key to success in the Grade 9 exam.
It offers a detailed understanding of the concept, providing invaluable insights into the topic.
By knowing the concepts well in advance, students can plan their preparation effectively.
Utilize this indispensable guide for a well-rounded preparation and achieve your desired results.
Chapter Notes: Carrying Out a Test for the Slope of a Regression Model
Chapter Notes: Carrying Out a Test for the Slope of a Regression Model Notes offer in-depth insights into the specific topic to help you master it with ease.
This comprehensive document covers all aspects related to Chapter Notes: Carrying Out a Test for the Slope of a Regression Model.
It includes detailed information about the exam syllabus, recommended books, and study materials for a well-rounded preparation.
Practice papers and question papers enable you to assess your progress effectively.
Additionally, the paper analysis provides valuable tips for tackling the exam strategically.
Access to Toppers' notes gives you an edge in understanding complex concepts.
Whether you're a beginner or aiming for advanced proficiency, Chapter Notes: Carrying Out a Test for the Slope of a Regression Model Notes on EduRev are your ultimate resource for success.
Chapter Notes: Carrying Out a Test for the Slope of a Regression Model Grade 9 Questions
The "Chapter Notes: Carrying Out a Test for the Slope of a Regression Model Grade 9 Questions" guide is a valuable resource for all aspiring students preparing for the
Grade 9 exam. It focuses on providing a wide range of practice questions to help students gauge
their understanding of the exam topics. These questions cover the entire syllabus, ensuring comprehensive preparation.
The guide includes previous years' question papers for students to familiarize themselves with the exam's format and difficulty level.
Additionally, it offers subject-specific question banks, allowing students to focus on weak areas and improve their performance.
Study Chapter Notes: Carrying Out a Test for the Slope of a Regression Model on the App
Students of Grade 9 can study Chapter Notes: Carrying Out a Test for the Slope of a Regression Model alongwith tests & analysis from the EduRev app,
which will help them while preparing for their exam. Apart from the Chapter Notes: Carrying Out a Test for the Slope of a Regression Model,
students can also utilize the EduRev App for other study materials such as previous year question papers, syllabus, important questions, etc.
The EduRev App will make your learning easier as you can access it from anywhere you want.
The content of Chapter Notes: Carrying Out a Test for the Slope of a Regression Model is prepared as per the latest Grade 9 syllabus.
|
© EduRev
|
Education Revolution
|


|


Signup to see your scores
go up within 7 days!
Access 1000+ FREE Docs, Videos and Tests
Takes less than 10 seconds to signup