Analytical Paragraph: Questions and Answers | English Class 10 PDF Download

Q1: The recent pandemic has had an adverse effect on every facet of life. ‗Young Minds‘ conducted a survey to show how the mental health of young people has been affected during this time. 2,111 young people took part in the survey which shows how the lockdown is not only impacting jobs and the economy but also mental health. Write an interpretation in 100-120 words on how lockdown in the times of COVID-19 has affected the mental health of young people.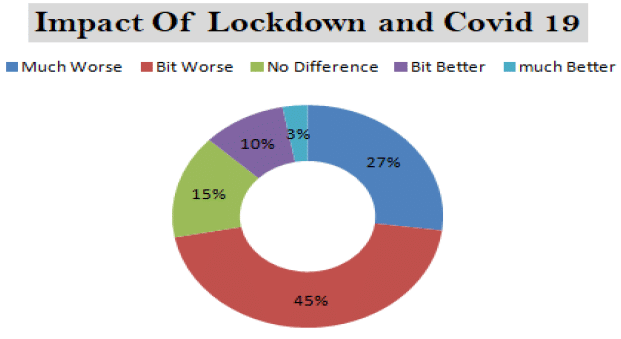
Ans: Impact of the 2020 Lockdown on Mental Health(A Survey by Young Minds)
Key InsightThe majority experienced negative effects, with very few reporting improvement. This highlights the urgent need to focus on mental well-being during crises like lockdowns.
- Over 25% of participants experienced depression during the lockdown.
- Nearly 50% felt worse mentally compared to before the lockdown.
- About 15% reported no change in their mental state.
- Only 13% felt better, enjoying more rest and relaxation.
Q2: The following excerpt is taken from ‗The Times‘ on the ill-treatment of animals and steps to prevent it. It is distressing to see the attitude of people towards animals and find that cases of cruelty towards animals are increasing. The following pie chart represents the attitude of people towards animals.‖ As Simran/ Dhruv, write the analysis of the above statement in 100-120 words.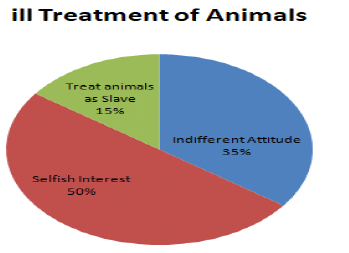
Ans: Human Attitudes Towards Animals
Important ReminderAnimals are rightful inhabitants of the Earth. If humans cannot support them, they have no right to increase their suffering.
- Humans have shown a harsh and insensitive attitude towards animals for centuries.
- A recent study revealed that 50% of animals are misused by people for selfish reasons.
- Many animals are killed for their decorative and valuable body parts, such as skin.
- The study also found that 35% of people are indifferent to animal pain and suffering and continue to abuse and experiment on them without remorse.
- Animals are often beaten and forced to carry burdens beyond their capacity.
- Additionally, 15% of people still consider animals as mere slaves.
Q3: You are the General Manager of a restaurant. You have noticed that the cost of seafood items has gone up in recent times and this has overshot the budgets of raw materials procurement. Your supplier explains that the supply chain of seafood items is adversely affected due to bad weather and a disruption in transport due to a strike, and consequently, the prices of seafood items have gone up. Write an analytical paragraph briefly describing how the cost of procuring seafood items has overshot the procurement budget of the restaurant and suggesting a solution to the problem in consultation with the restaurant chef and sales and marketing manager such that the seafood continues to be on the menu but the restaurant does not incur any losses or lose valuable customers to the competition. You might also like to introduce a new menu with attractive alternatives to seafood.
Ans: The restaurant is currently facing increasing challenges in offering a variety of seafood dishes such as prawns, shrimps, crabs, lobsters, oysters, and tuna. This situation has disappointed some customers, but the restaurant cannot meet their expectations without exceeding its monthly seafood ingredient budget.
Our supplier, Messrs Bombay Seafood Suppliers, has informed us that due to bad weather and a transport strike, they are unable to supply these seafood items at the current prices.
To address this, the restaurant is considering three possible solutions:
Raising the prices of seafood dishes.
Reducing portion sizes to conserve raw materials.
Launching a two-week food festival featuring a refreshed menu with non-vegetarian options such as chicken, mutton, lamb, freshwater fish, and eggs, along with new Indian and Chinese vegetarian dishes, including popular South Indian items.
This strategy aims to manage procurement costs more effectively while ensuring customer satisfaction by offering a diverse and appealing alternative menu. The Chief Chef and the Food and Beverages Manager support this plan.
Pending management approval, the food festival could begin as early as next weekend.
Q4: The present generation is well updated in the use of the internet and computers. Let‘s look at the data arising out of a recent survey that was done to ascertain the time spent on the utilisation of the computer and internet for varied purposes. Write an analytical paragraph for the above bar chart in 100-120 words.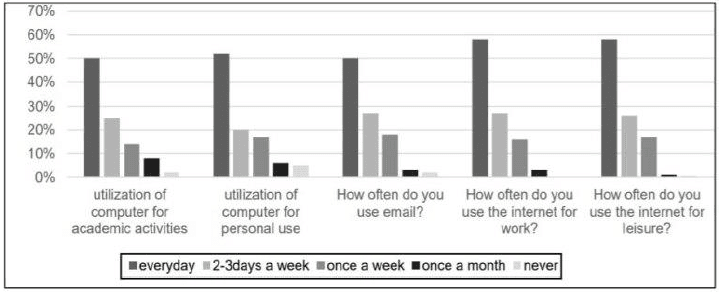
Ans: Computer and Internet Usage by Purpose (Monthly Survey)
Conclusion data clearly indicate that computers and the internet are gradually becoming essential tools across all areas of life.
- The survey shows that all five categories—academics, personal use, e-mail, work, and leisure—are used by at least 50% of people daily.
- Leisure use is especially common, with nearly everyone accessing computers and the internet at least once a month, and 30% using them weekly.
- Most people use computers for work at least once a month.
- Less than 10% have never accessed e-mail.
- For academic purposes, 50% of students use computers and the internet daily, while over 20% use them 2–3 times a week.
- Only 2% never use computers and the internet for academic work.
Q5: Given below are the results of a phone survey of a group of 1000 students aged 13-16 carried out by an education company to find out how effective online classes are. Study the data carefully and then write an analytical paragraph to summarise the information. Make comparisons wherever appropriate and draw your own conclusions.
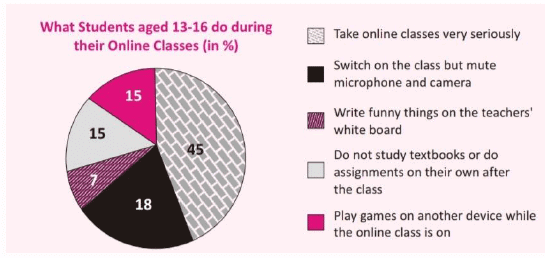
Ans: Student Engagement in Online Classes(Based on a Pie Chart from a Phone Survey of 1,000 Students Aged 13 to 16)
The conclusion pie chart data suggest that a majority engage well, but there remains a significant need to enhance student discipline and engagement for effective online education.
- The pie chart shows that 45% of students take online learning seriously, reflecting their familiarity with digital tools and the promise of online education.
- 18% attend online classes with microphones and cameras turned off, which may make sessions easier to manage but limits crucial interaction.
- A small group of 7% do not take classes seriously and may disrupt sessions, such as by writing jokes on the teacher’s digital whiteboard.
- Fifteen per cent admitted to playing games during class, which affected their focus on learning.
- Another 15% neither study textbooks nor complete assignments independently after class.
Q6: You are a teacher at a reputed school in the city. The following bar graph shows a comparative analysis of students‘ performance in different subjects in the terminal exam. Write an analytical paragraph on the variation in the performances of students in about 100-120 words to be presented at the Annual teachers' meet.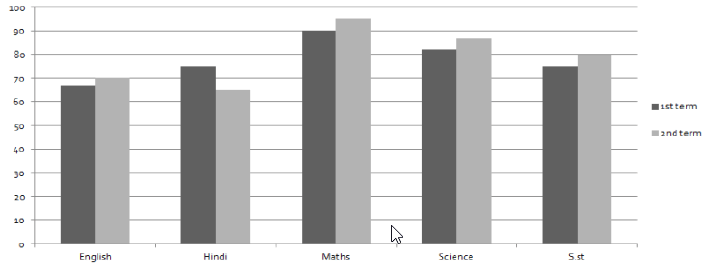
Ans: Student Performance in Terminal Exams
RecommendationsTo enhance overall performance in the upcoming academic year, teachers should strategize effectively, emphasizing extra practice in Maths and Science. This approach may help more students achieve full marks and improve the school’s board exam results.
- The survey highlights noticeable improvement in Maths and Science in the second term, with most students achieving higher marks.
- Scores in both subjects were above 80 in the first term, and in the second term, most students scored over 90 in Maths.
- In contrast, Hindi and English scores mostly ranged between 60 and 70, with Hindi performance declining in the second term, indicating a need for greater focus.
- English and Social Science showed only slight improvement.
Q7: A survey was conducted among the parents of the school going students. The question asked was,
Should schools reopen in October? The results are shown in the pie chart below. Write an analytical paragraph in 100-120 words.
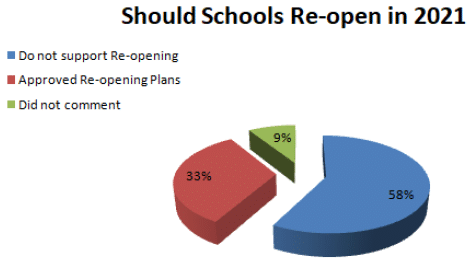
Ans: Parent Opinions on School Reopening After COVID-19(Based on Survey Data)
Summary
- The pie chart indicates that 58% of parents are hesitant to send their children back to school.
- About 33% of parents support reopening schools.
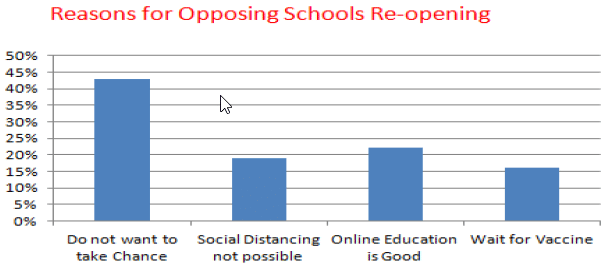
- Among parents unwilling to send their children:
- Over 40% are concerned about the inability to maintain social distancing on school premises.
- Around 20% prefer continuing with online education.
- 15% prefer to wait until a vaccine is available, trusting in its effectiveness.
Given these concerns, schools are unlikely to operate at full capacity soon, as only a third of parents agree with the reopening plan.
Q8: The given line graph provides information about changes in birth and death rates in New Zealand between 1901and 2101. Write an analytical paragraph that summarises information and makes comparisons where relevant in about 100- 120 words.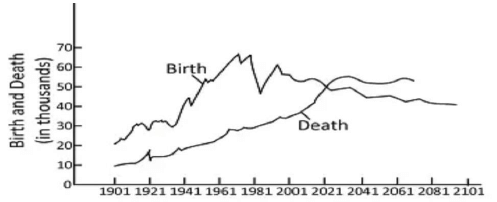
Ans: Trends in Birth and Death Rates (1901–2101)
- From 1901 to 2041, the birth rate remained consistently higher than the death rate.
- In 1901, the birth rate was around 20,000 and gradually increased, peaking at approximately 65,000 in 1961.
- After 1961, birth rates fluctuated between 50,000 and 60,000 but are projected to decline steadily, reaching about 42,000 by 2101.
- The death rate started at about 10,000 in 1901 and has steadily increased over time.
- From 2021 onwards, a sharp rise in death rate is expected, stabilising at around 60,000 between 2061 and 2081, with a slight drop by 2101.
- Between 1961 and 2001, there was a significant gap between birth and death rates, but this gap is projected to narrow in the coming decades.
- Overall, the data suggests that the death rate will surpass the birth rate in the latter half of the 21st century.
Q9: Critically analyse the line graph given below and write down your conclusions of it in a paragraph.
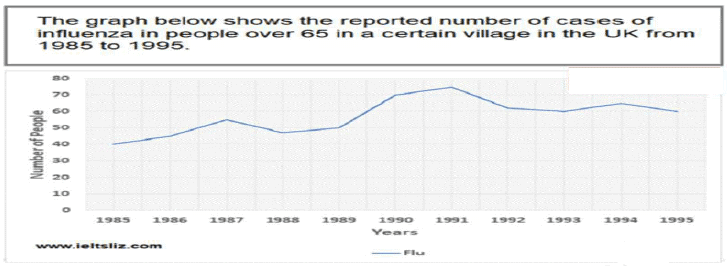
Ans: Influenza Cases Among People Aged 65 and Above in a UK Village (1985–1995)
- The graph shows a noticeable rise in influenza cases among elderly individuals over this period.
- In 1985, there were 40 reported cases, which gradually increased to 55 cases by 1987.
- A slight decline occurred in 1988, with cases falling to just under 50.
- This was followed by a sharp rise, peaking at 75 cases in 1991.
- After 1991, cases declined to around 60 by 1993.
- From 1993 to 1995, the number of cases remained fairly steady at about 60, with a minor rise of approximately 5 cases during this time.
Q10: The pie chart shows the proportion of people from different households living in poverty in the UK in 2020. Write an analytical paragraph to describe the information in 100-120 words.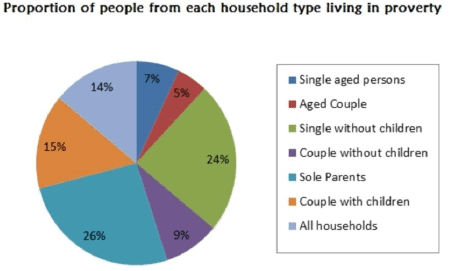
Ans: Household Types in Poverty in the UK (2020)(Based on a Pie Chart)
Additional Insights
- Sole-parent households make up the largest share of those living in poverty at 26%.
- Single individuals without children closely follow, accounting for 24%.
- Couples without children represent a smaller portion, at 9%.
- Couples with children make up 15% of impoverished households.
- Elderly individuals living alone and aged couples together constitute 12% of the total.
- Overall, 14% of all UK households were classified as living in poverty in 2020.
The data indicates that younger households experienced higher poverty rates than older ones, and couples without children were financially better off compared to those with children.
|
61 videos|620 docs|69 tests
|
FAQs on Analytical Paragraph: Questions and Answers - English Class 10
| 1. What are the key topics covered in the Class 10 analytical paragraph exam? |  |
| 2. How can I improve my analytical writing skills for the Class 10 exam? | |
| 3. What is the structure of an analytical paragraph in the Class 10 exam? | |
| 4. Are there specific literary devices I should focus on for the Class 10 analytical paragraph? | |
| 5. How can I manage my time effectively during the Class 10 analytical paragraph exam? | |


Free
,Exam
,practice quizzes
,Analytical Paragraph: Questions and Answers | English Class 10
,Sample Paper
,mock tests for examination
,study material
,Important questions
,Analytical Paragraph: Questions and Answers | English Class 10
,Viva Questions
,Semester Notes
,past year papers
,MCQs
,Previous Year Questions with Solutions
,Analytical Paragraph: Questions and Answers | English Class 10
,shortcuts and tricks
,ppt
,video lectures
,Extra Questions
,Objective type Questions
,Summary
;


Analytical Paragraph: Questions and Answers Free PDF Download
Importance of Analytical Paragraph: Questions and Answers
Analytical Paragraph: Questions and Answers Notes
Analytical Paragraph: Questions and Answers Class 10
Study Analytical Paragraph: Questions and Answers on the App
|
© EduRev
|
Education Revolution
|


|


