Practice Questions: Data Handling and Presentation | Mathematics for Class 6 PDF Download

Q1: A survey was conducted on 65 students about their favorite sport. The tally marks are: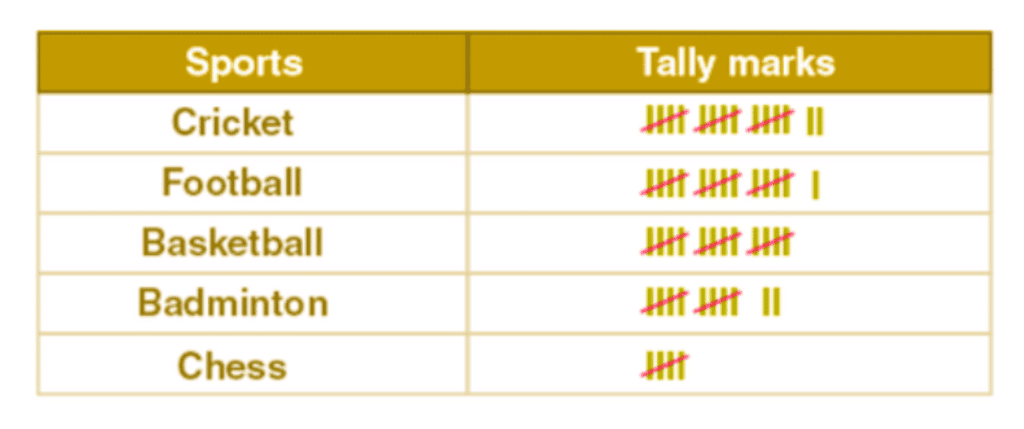
Find:
a) How many students prefer cricket?
b) Which sport is the least popular?
Sol: a) Cricket = 17 students
b) Chess ( 5 students)
Q2: A pictograph shows the number of books sold in a week: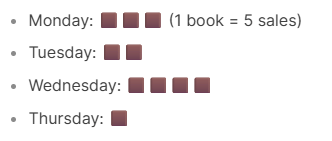
Find:
a) Total sales on Wednesday.
b) The day with the fewest sales.
c) Difference between Monday and Thursday.
Sol:
a) Wednesday = 4 × 5 = 20 books
b) Thursday (5 books)
c) Monday (15) – Thursday (5) = 10 books
Q3: The number of trees planted in 4 cities:
Delhi: 25
Mumbai: 15
Bangalore: 20
Kolkata: 10
Represent this using a pictograph (1 symbol = 5 trees).
Sol: 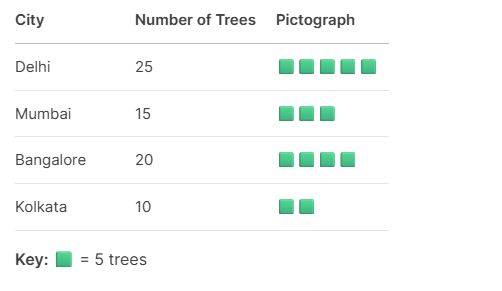
Q4: A bar graph shows the monthly rainfall (in cm):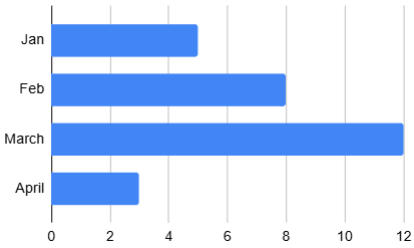
Find:
a) The wettest month.
b) Total rainfall in 4 months.
c) Ratio of Feb to Apr rainfall.
Sol:
a) March (12 cm)
b) 5 + 8 + 12 + 3 = 28 cm
c) 8:3
Q5: The number of cars sold in a week:
- Mon: 10
- Tue: 15
- Wed: 5
- Thu: 20
- Fri: 12
Represent this data in a bar graph (Scale: 1 unit = 5 cars).
Sol: 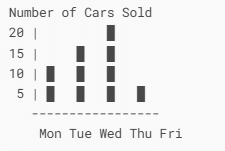
Q6: A class has two sections (A & B) with test scores:
- Section A: 12, 15, 18, 20
- Section B: 10, 14, 16, 22
Find:
a) Mean score of each section.
b) Which section performed better on average?
Sol:
a) Section A: (12+15+18+20)/4 = 16.25
Section B: (10+14+16+22)/4 = 15.5
b) Section A has a higher mean.
Q7: A survey of 50 people found:
- 20% prefer tea,
- 30% coffee,
- 50% juice.
How many people prefer each drink?
Sol:
- Tea: 20% of 50 = 10 people
- Coffee: 30% of 50 = 15 people
- Juice: 50% of 50 = 25 people
Q8: The daily temperatures (°C) for 5 days: 22, 24, 26, 20, 18.
Find:
a) Range.
b) Median.
Sol:
a) Range = 26 – 18 = 8°C
b) Sorted: 18, 20, 22, 24, 26
→ Median = 22°C
Q9: A graph shows ice cream sales for two years: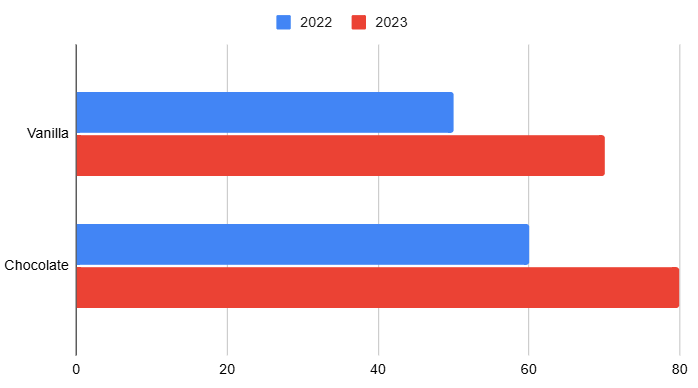
Find:
a) Total sales increase for chocolate.
b) Which flavor had a greater percentage increase?
Solution:
a) 80 – 70 = 10 more sales
b) Vanilla growth = (60-50)/50 × 100 = 20%
Chocolate growth = (80-70)/70 × 100 ≈ 14.3%
Vanilla grew more.
Q10: A pie chart shows expenses: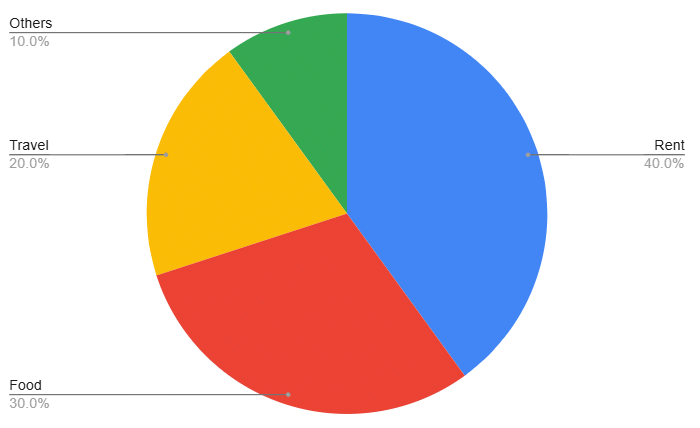
If total expenses = ₹50,000, find the amount spent on food.
Sol:
Food = 30% of ₹50,000 = ₹15,000
|
48 videos|334 docs|23 tests
|
FAQs on Practice Questions: Data Handling and Presentation - Mathematics for Class 6
| 1. What is data handling in the context of Class 6? |  |
| 2. Why is data presentation important for students? | |
| 3. What types of graphs are commonly taught in Class 6 data handling? | |
| 4. How can students collect data for their projects? | |
| 5. What skills do students develop through data handling activities? | |


Free
,Extra Questions
,Previous Year Questions with Solutions
,Practice Questions: Data Handling and Presentation | Mathematics for Class 6
,study material
,past year papers
,Viva Questions
,Sample Paper
,mock tests for examination
,Semester Notes
,ppt
,shortcuts and tricks
,Objective type Questions
,Important questions
,Practice Questions: Data Handling and Presentation | Mathematics for Class 6
,Practice Questions: Data Handling and Presentation | Mathematics for Class 6
,MCQs
,practice quizzes
,Exam
,Summary
,video lectures
;


Practice Questions: Data Handling and Presentation Free PDF Download
Importance of Practice Questions: Data Handling and Presentation
Practice Questions: Data Handling and Presentation Notes
Practice Questions: Data Handling and Presentation Class 6
Study Practice Questions: Data Handling and Presentation on the App
|
© EduRev
|
Education Revolution
|


|


within 7 days!