Arun Sharma Summary: Venn Diagrams & Set Theory | Logical Reasoning (LR) and Data Interpretation (DI) - CAT PDF Download
| Table of contents |
|
| Introduction |
|
| Formula Used |
|
| Solved Examples |
|
| Important Formula Table |
|

Introduction
- Set Theory and Venn Diagrams constitute a critical component of the CAT exam, with applications spanning both the Quantitative Aptitude and Logical Reasoning & Data Interpretation (LRDI) sections.
- The ability to organize, interpret, and analyze data involving multiple categories or overlapping groups is essential for efficiently solving a wide range of real-world and exam-oriented problems.
- This document is designed to provide CAT aspirants with a structured and analytical approach to Arun Sharma Summary of the chapter Venn Diagrams and Set theory for better grasp and clarity.

Formula Used
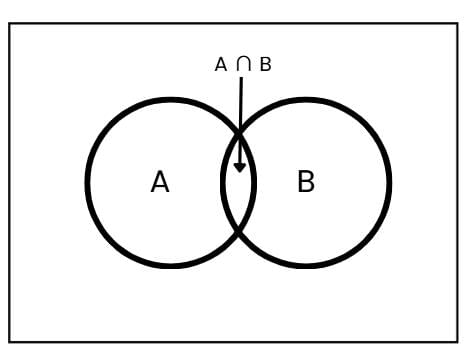
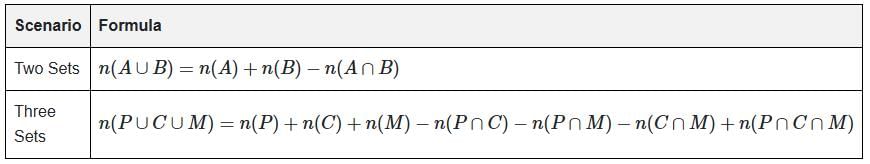
1. The total number of elements in at least one set (out of two sets) is given by:
n(A ∪ B) = n(A) + n(B) - n(A ∩ B)
Where:
- n(A) : Number of elements in set A.
- n(B) : Number of elements in set B.
- n(A ∩ B): Number of elements in both A and B.
2. The total number of elements in at least one set (out of three sets) is given by:

Where:
- n(P), n(C), n(M): Sizes of sets P, C, M.
- n(P ∩ C), n(P ∩ M), n(C ∩ M): Pairwise intersections.
- n(P ∩ C ∩ M): Triple intersection.
Solved Examples
Q1: In a survey of 200 students, 140 like cold drinks, 120 like milkshakes and 80 like both . How many students like at least one of the drinks?
Sol:
n(A) = 140 ,
n(B) = 120 , n(A ∩ B) = 80
Using the formula:
n(A ∪ B) = 140 + 120 - 80 = 180
Thus, 180 students like at least one of the drinks.
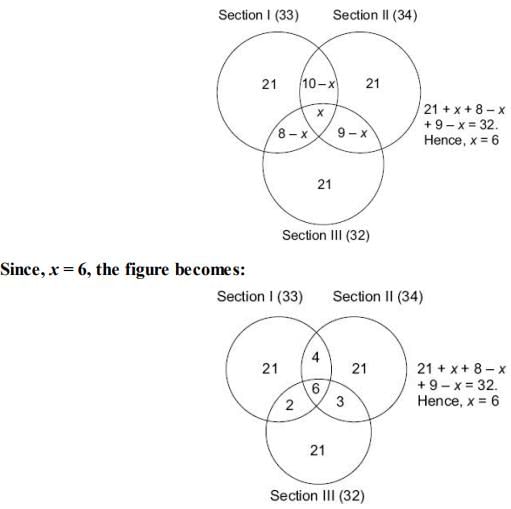
Q2: Last year, there were 3 sections in the Catalyst, a mock CAT paper. Out of them 33 students cleared the cut-off in Section 1, 34 students cleared the cut-off in Section 2 and 32 cleared the cut-off in Section 3. 10 students cleared the cut-off in Section 1 and Section 2, 9 cleared the cut-off in Section 2 and Section 3, 8 cleared the cut-off in Section 1 and Section 3.
The number of people who cleared each section alone was equal and was 21 for each section.
i. How many cleared all three sections?
(a) 3
(b) 6
(c) 5
(d) 7
Sol:
We’re given that:
Section 1 total = 33
Section 1 & 2 = 10 → includes those who cleared all three → so (Section 1 & 2 only) = 10 – x
Section 1 & 3 = 8 → (Section 1 & 3 only) = 8 – x
all three = x
only Section 1 = 21
Now plug in:
33 = 21 + (10 – x) + (8 – x) + x
→ 33 = 21 + 10 – x + 8 – x + x
→ 33 = 39 – x
→ x = 6
ii. How many cleared only one of the three sections?
(a) 21
(b) 63
(c) 42
(d) 52
Sol:
Students who cleared only one section are those who did not clear any of the other two.
So, the total number of students who cleared only one section = only Section 1 + only Section 2 + only Section 3
= 21 + 21 + 21
= 63

iii. The ratio of the number of students clearing the cut-off in one or more of the sections to the number of students clearing the cut-off in Section 1 alone is?
(a) 78/21
(b) 3/4
(c) 73/21
(d) None of these
Ans:
We are asked to find the ratio of the number of students clearing the cut-off in one or more of the sections to those clearing the cut-off in Section 1 alone.
From the given data:
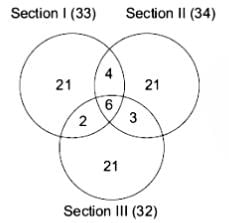
Only Section 1 = 21
Only Section 2 = 21
Only Section 3 = 21
Section 1 and 2 only = 10 – 6 = 4
Section 2 and 3 only = 9 – 6 = 3
Section 1 and 3 only = 8 – 6 = 2
All three sections = 6
Total students who cleared one or more sections =
21 (only S1) + 21 (only S2) + 21 (only S3) + 4 (S1 & S2 only) + 3 (S2 & S3 only) + 2 (S1 & S3 only) + 6 (all three) = 78Students who cleared Section 1 alone = 21
So, the required ratio = 78 / 21
Important Formula Table
|
77 videos|180 docs|96 tests
|
FAQs on Arun Sharma Summary: Venn Diagrams & Set Theory - Logical Reasoning (LR) and Data Interpretation (DI) - CAT
| 1. What is set theory and why is it important in mathematics? |  |
| 2. How do Venn diagrams help in understanding set operations? | |
| 3. What are the key formulas used in set theory? | |
| 4. What are some common applications of set theory in real life? | |
| 5. How can I effectively use Venn diagrams for solving problems in set theory? | |


video lectures
,Objective type Questions
,Arun Sharma Summary: Venn Diagrams & Set Theory | Logical Reasoning (LR) and Data Interpretation (DI) - CAT
,Important questions
,practice quizzes
,Viva Questions
,Free
,mock tests for examination
,Previous Year Questions with Solutions
,Arun Sharma Summary: Venn Diagrams & Set Theory | Logical Reasoning (LR) and Data Interpretation (DI) - CAT
,Extra Questions
,Summary
,Semester Notes
,Sample Paper
,past year papers
,ppt
,shortcuts and tricks
,MCQs
,Arun Sharma Summary: Venn Diagrams & Set Theory | Logical Reasoning (LR) and Data Interpretation (DI) - CAT
,Exam
,study material
;


Arun Sharma Summary: Venn Diagrams & Set Theory Free PDF Download
Importance of Arun Sharma Summary: Venn Diagrams & Set Theory
Arun Sharma Summary: Venn Diagrams & Set Theory Notes
Arun Sharma Summary: Venn Diagrams & Set Theory CAT Questions
Study Arun Sharma Summary: Venn Diagrams & Set Theory on the App
|
© EduRev
|
Education Revolution
|


|


