Data Handling Chapter Notes | Mathematics Class 4 ICSE PDF Download
| Table of contents |
|
| Introduction |
|
| Pictograph |
|
| Bar Graphs |
|
| Horizontal Bar Graph |
|
| Vertical Bar Graph |
|

Introduction
Data is all around us, from the number of friends who like certain fruits to the votes in a school election! The chapter "Data Handling" in Class 4 Mathematics is like a treasure map that helps us organize and understand this information in fun and simple ways. By learning how to arrange data using pictures or bars, we can discover interesting patterns and answers, like finding out which fruit is the favorite or who won an election. Let’s dive into the exciting world of pictographs and bar graphs to make sense of data in a clear and colorful way!
Pictograph
- A pictograph uses pictures or symbols to show data in an organized way.
- Each picture or symbol stands for a specific number of items.
- It needs a title to explain what the data is about.
- A key is included to show what each symbol represents.
Steps to create a pictograph:
- Collect the data you want to show.
- Choose a symbol or picture to represent the data.
- Decide the value of each symbol (e.g., one symbol = 100 items).
- Draw the symbols for each category based on the data.
- Add a title and a key to make it clear.
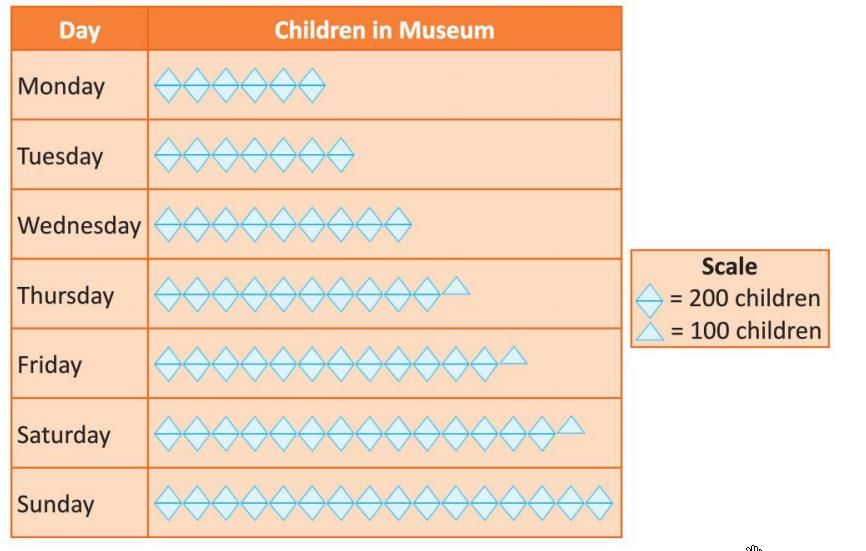
Example: The number of children visiting a museum in a week is given:
To create a pictograph:
- Choose a symbol, like a triangle, where one triangle = 100 children and two triangles = 200 children.
- For Monday, draw 12 triangles (since 1,200 ÷ 100 = 12).
- For Tuesday, draw 14 triangles (1,400 ÷ 100 = 14).
- Continue for other days: Wednesday (18), Thursday (21), Friday (25), Saturday (29), Sunday (32).
- Add a title: "Children Visiting Museum in a Week."
- Add a key: "One triangle = 100 children."
Bar Graphs
- Bar graphs show data using bars of different heights or lengths.
- They help compare data easily.
- Bars are drawn with equal spaces between them.
- A scale is chosen to show the value of each bar (e.g., 1 cm = 10 units).
- Bar graphs can be horizontal or vertical.
Steps to create a bar graph:
- Collect the data to be represented.
- Choose a scale that fits the data.
- Draw two lines: one horizontal (x-axis) and one vertical (y-axis), meeting at zero.
- Label the axes with categories (e.g., days) and values (e.g., number of items).
- Draw bars for each category according to the scale.
- Add a title to describe the graph.
Horizontal Bar Graph
- Bars are drawn side by side along the horizontal axis.
- The length of each bar shows the value of the data.
- It is useful for comparing categories like types of fruits or flavors.
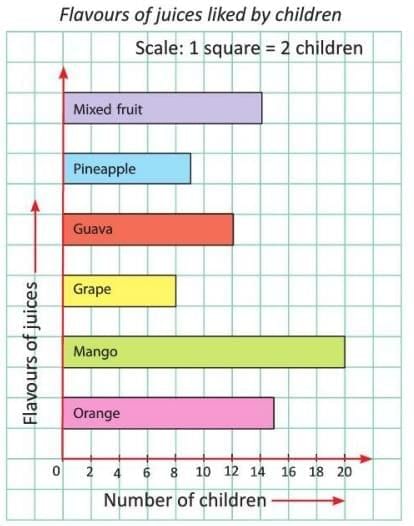
Example: A horizontal bar graph shows the number of children who like different juice flavors: Mango (20), Grape (8), Orange (15), Pineapple (12), Apple (9), Mixed Fruit (14).
- Draw a horizontal line (x-axis) and mark numbers (e.g., 0, 2, 4, 6, 8, 10, ... till 20).
- Draw a vertical line (y-axis) and label it with flavors.
- Choose a scale, e.g., 1 square = 2 children.
- Draw bars: Mango (20 squares), Grape (8 squares), Orange (15 squares), Pineapple (12 squares), Apple (9 squares), Mixed Fruit (14 squares)
- Add a title: "Flavours of Juices Liked by Children."
Vertical Bar Graph
- Bars are drawn upwards along the vertical axis.
- The height of each bar shows the value of the data.
- It is used to compare data like votes or scores.
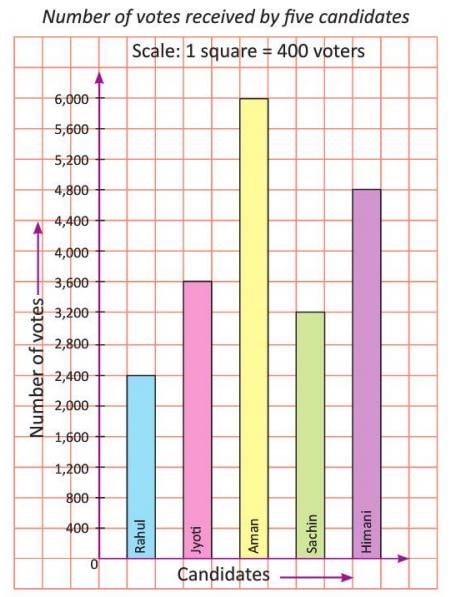
Example: A vertical bar graph shows votes for five candidates: Aman (6,000), Bharti (4,000), Chetan (2,800), Himani (4,800), Rahul (2,400).
- Draw a vertical line (y-axis) and mark numbers (e.g., 0, 400, 800, 1200, 1600, 2,000,.... till 6,000).
- Draw a horizontal line (x-axis) and label it with candidate names.
- Choose a scale, e.g., 1 square = 400 votes.
- Draw bars: Aman ( 15 squares), Jyoti (9 squares), Sachin ( 8 squares), Himani (12 squares), Rahul (6 squares).
- Add a title: "Number of Votes Received by Five Candidates."
|
82 docs|14 tests
|
FAQs on Data Handling Chapter Notes - Mathematics Class 4 ICSE
| 1. What is a pictograph and how is it used in data handling? |  |
| 2. How do you read and interpret a bar graph? | |
| 3. What is the difference between a pictograph and a bar graph? | |
| 4. How can you create a simple bar graph? | |
| 5. Why is data handling important for students? | |


Extra Questions
,mock tests for examination
,Data Handling Chapter Notes | Mathematics Class 4 ICSE
,study material
,practice quizzes
,Objective type Questions
,shortcuts and tricks
,video lectures
,Summary
,Exam
,Semester Notes
,Sample Paper
,Data Handling Chapter Notes | Mathematics Class 4 ICSE
,Free
,ppt
,past year papers
,Data Handling Chapter Notes | Mathematics Class 4 ICSE
,MCQs
,Previous Year Questions with Solutions
,Important questions
,Viva Questions
;


Chapter Notes: Data Handling Free PDF Download
Importance of Chapter Notes: Data Handling
Chapter Notes: Data Handling
Chapter Notes: Data Handling Class 4 Questions
Study Chapter Notes: Data Handling on the App
|
© EduRev
|
Education Revolution
|


|


