Co-ordinate Geometry Chapter Notes | Mathematics Class 9 ICSE PDF Download

Introduction
Co-ordinate Geometry is a fascinating branch of mathematics where numbers and shapes come together to create a map of points in space. Imagine plotting a treasure map where each location is marked by a pair of numbers, guiding you through a grid of lines. This chapter introduces you to the art of locating points using coordinates and understanding their relationships with various geometric figures, all based on a system of perpendicular lines called axes. By mastering these concepts, you'll unlock the ability to visualize and solve problems involving positions and patterns in a plane, making math both logical and exciting!
- Co-ordinate Geometry uses two numbers, called coordinates, to pinpoint a location in a plane.
- It involves two perpendicular number lines, known as coordinate axes, to define positions.
- The study includes:
- Locating points using coordinates (co-ordinate aspect).
- Understanding how points relate to geometric shapes (geometry aspect).
- Example: A point at (3, 4) is located by moving 3 units right along the horizontal axis and 4 units up along the vertical axis, showing its position relative to the axes.
Dependent and Independent Variables
- In linear equations like 3x + 4y = 5, x and y are variables representing coordinates.
- Dependent variable: The variable whose value depends on the other (solved as the subject of the equation).
- Independent variable: The variable that determines the value of the dependent variable.
- Steps to identify variables:
- If the equation is solved for y (e.g., y = mx + c), y is dependent, x is independent.
- If solved for x (e.g., x = ay + b), x is dependent, y is independent.
- Example: For the equation 4x - 5y + 20 = 0:
- (i) Solve for x: 4x = 5y - 20 → x = (5/4)y - 5. Here, x is dependent, y is independent.
- (ii) Solve for y: -5y = -4x - 20 → y = (4/5)x + 4. Here, y is dependent, x is independent.
Ordered Pair
An ordered pair is a set of two numbers written in a specific order, denoted as (a, b).
Steps to understand ordered pairs:
- Write numbers in a specific order, separated by a comma, inside parentheses.
- First number (a) is the first component, second number (b) is the second component.
- Order matters: (a, b) ≠ (b, a) unless a = b.
- Equal ordered pairs have equal corresponding components: (a, b) = (c, d) means a = c and b = d.
- Components can be equal, e.g., (5, 5).
Example: For (x, 4) = (-7, y), compare components: x = -7 and y = 4.
Cartesian Plane
- A Cartesian plane is formed by two perpendicular number lines intersecting at their zero points.
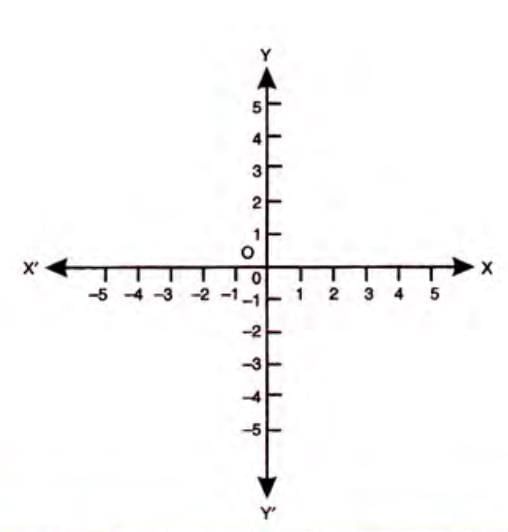
- Components:
- Horizontal line (XOX'): x-axis.
- Vertical line (YOY'): y-axis.
- Intersection point (O): origin, with coordinates (0, 0).
- The x-axis and y-axis together form the Cartesian coordinate system.
Co-ordinates of Points
Each point in a Cartesian plane is represented by an ordered pair (x, y).
Steps to find coordinates:
- Measure the distance from the origin along the x-axis: this is the x-coordinate (abscissa).
- Measure the distance from the origin along the y-axis: this is the y-coordinate (ordinate).
- Write as (abscissa, ordinate), e.g., (x, y).
Example: For a point with abscissa 4 and ordinate 2, the coordinates are (4, 2).
Quadrants and Sign Convention
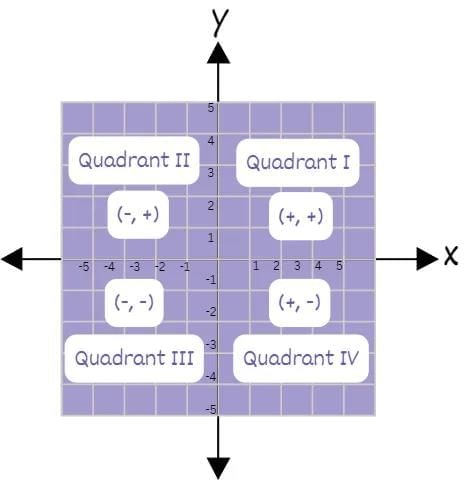
The coordinate axes divide the plane into four quadrants.
Quadrant naming (anti-clockwise from OX):
- First quadrant (XOY): Both x and y are positive.
- Second quadrant (X'OY): x is negative, y is positive.
- Third quadrant (X'OY'): Both x and y are negative.
- Fourth quadrant (Y'OX): x is positive, y is negative.
Sign convention:
- First quadrant: (+, +)
- Second quadrant: (-, +)
- Third quadrant: (-, -)
- Fourth quadrant: (+, -)
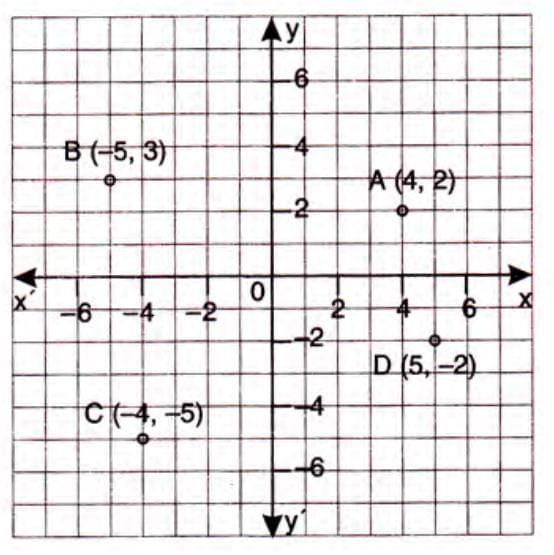
Example: Point A(4, 2) is in the first quadrant (x = 4, y = 2, both positive), while point C(-4, -5) is in the third quadrant (x = -4, y = -5, both negative).
Plotting of Points
- Plotting a point involves locating its position on the Cartesian plane using its coordinates.
- Steps to plot a point:
- Start at the origin (0, 0).
- Move along the x-axis (right for positive, left for negative) by the x-coordinate.
- From there, move along the y-axis (up for positive, down for negative) by the y-coordinate.
- Mark the point and label it.
- Special cases:
- Origin: (0, 0).
- Points on x-axis: (x, 0), e.g., (7, 0).
- Points on y-axis: (0, y), e.g., (0, 8).
Example: To plot A(4, 2):
- Move 4 units right along the x-axis.
- Move 2 units up parallel to the y-axis.
- Mark and label the point as A(4, 2).
Graphs of x=0, y=0, x=a, y=a, etc.
Equations of specific lines: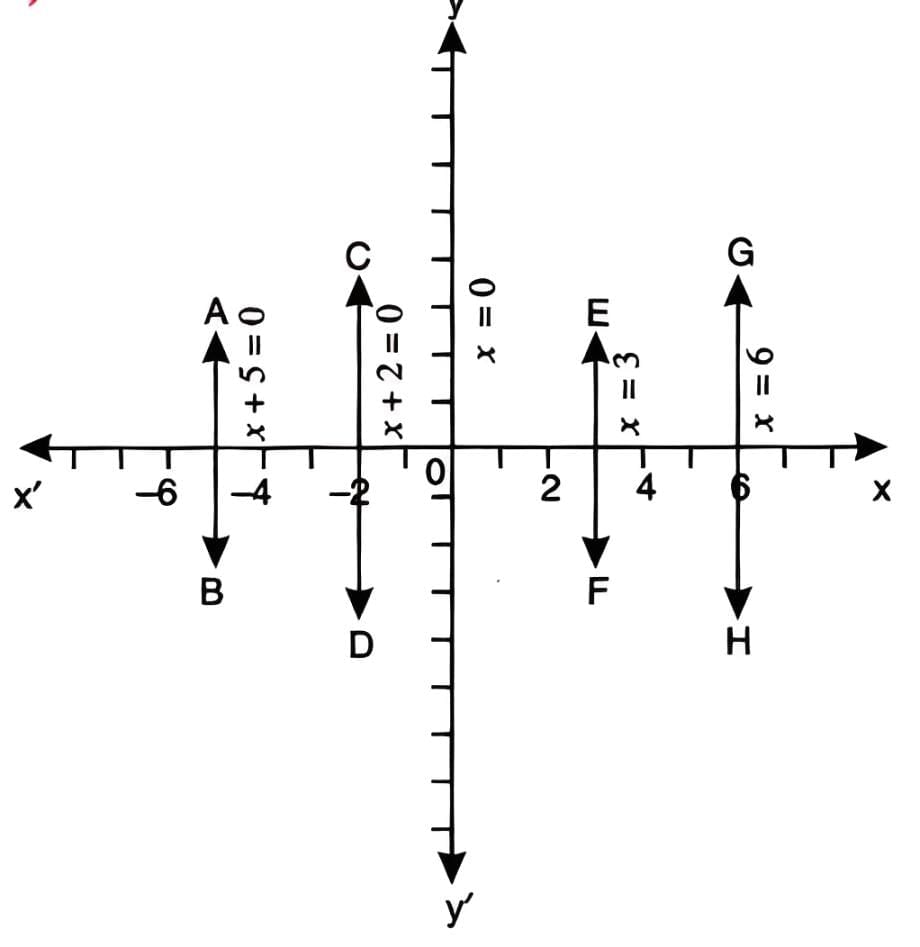
- x = 0: Represents the y-axis, as all points have x-coordinate 0 (e.g., (0, 7)).
- x = a: A line parallel to the y-axis at a distance of 'a' units (e.g., x = -5 for a line 5 units left of the y-axis).
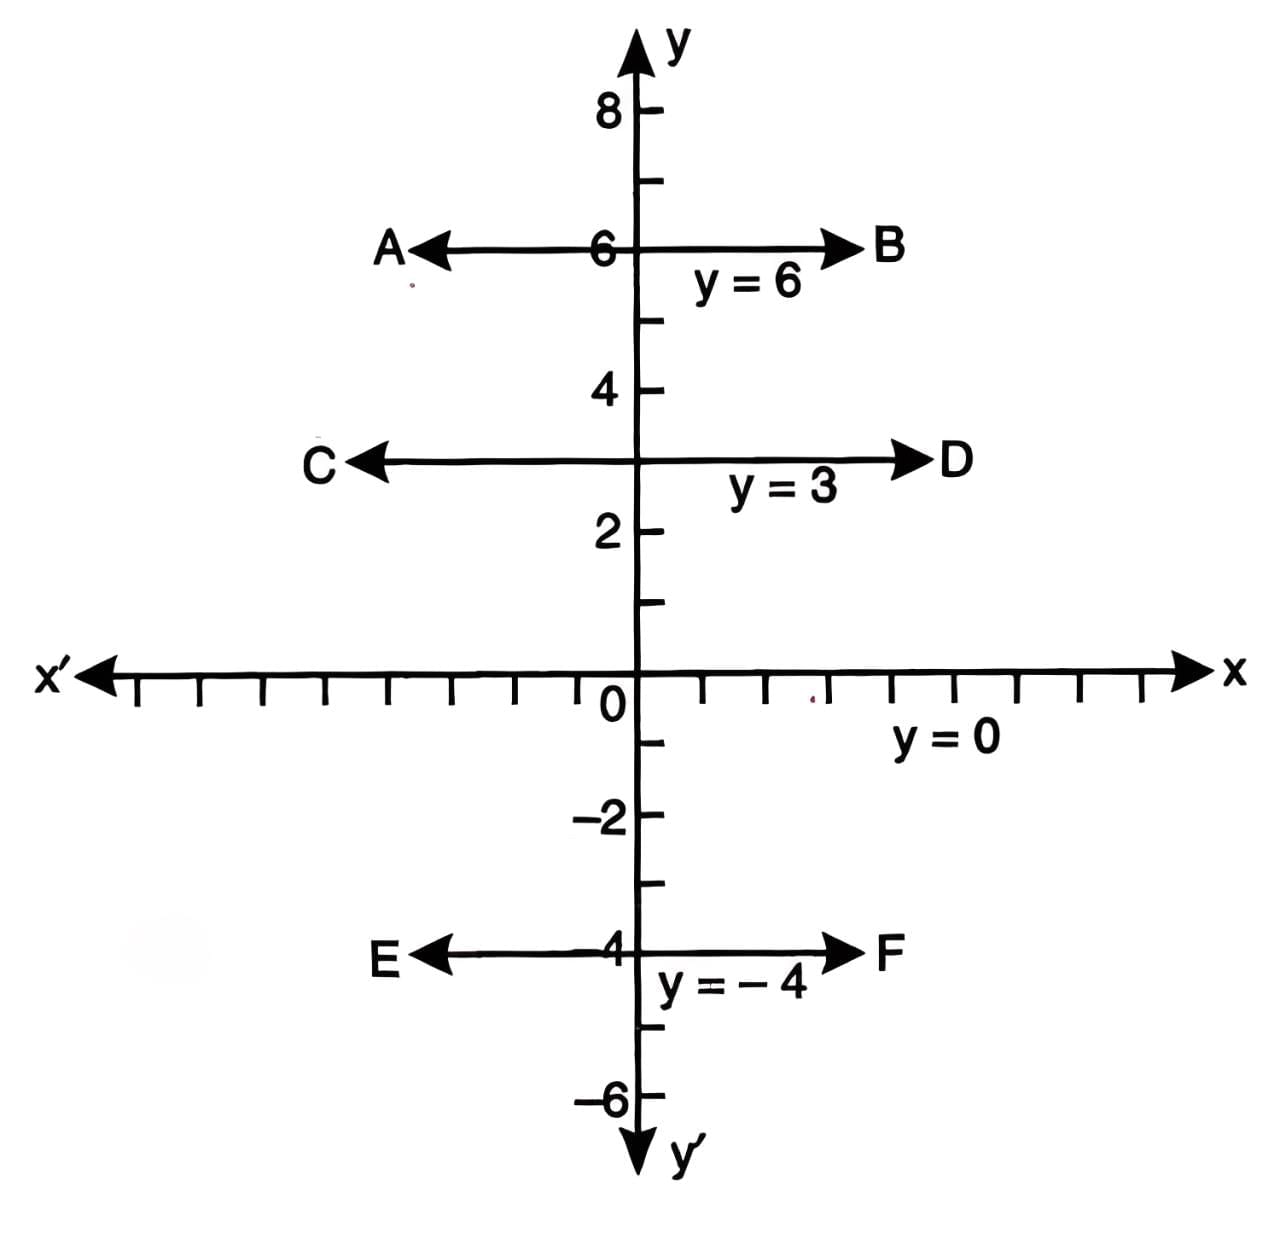
- y = 0: Represents the x-axis, as all points have y-coordinate 0 (e.g., (8, 0)).
- y = a: A line parallel to the x-axis at a distance of 'a' units (e.g., y = 6 for a line 6 units above the x-axis).
Example: For y = 3, y + 5 =0, x = 4, x + 6= 0. The graphs are straight lines parallel to the x-axis at a distance of 3 units above it.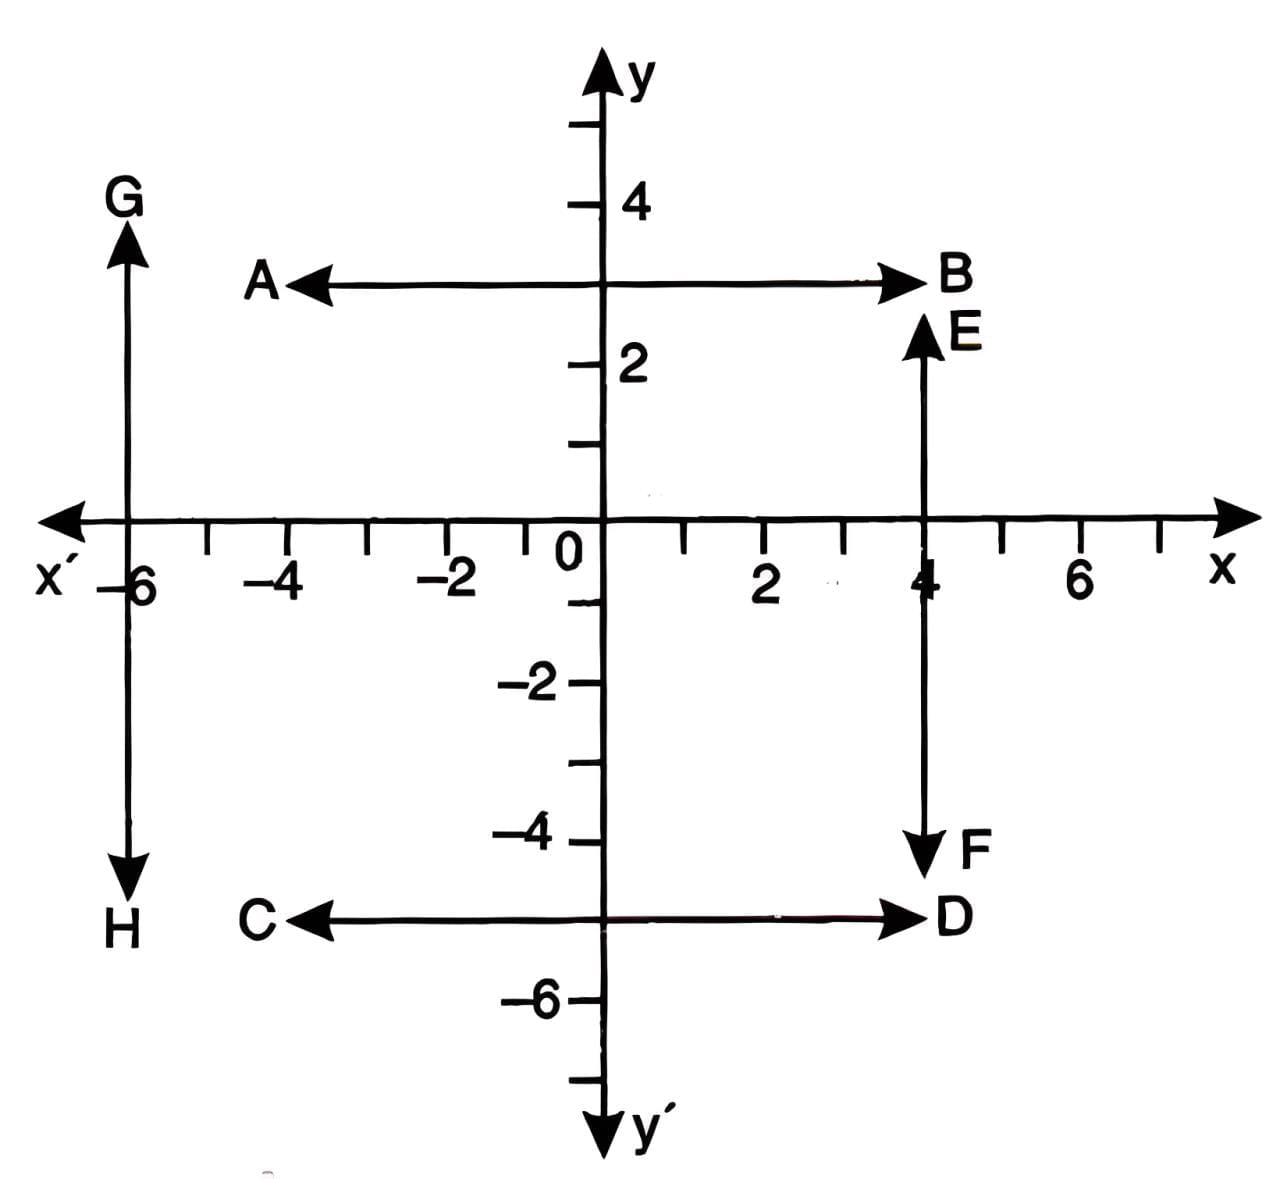
Graphing a Linear Equation
- A linear equation produces a straight-line graph.
- Steps to graph a linear equation:
- Find at least three points that satisfy the equation by choosing values for x and calculating y.
- Create a table of x and y values.
- Plot the points on a graph and draw a straight line through them.
- Types of linear equations:
- Type 1: y = mx (passes through the origin).
- Type 2: y = mx + c (c is the y-intercept, not zero).
- General form: ax + by + c = 0.
- Example: For y = -2x:
- Choose x = 0: y = -2 × 0 = 0 → (0, 0).
- Choose x = 3: y = -2 × 3 = -6 → (3, -6).
- Choose x = -2: y = -2 × -2 = 4 → (-2, 4).
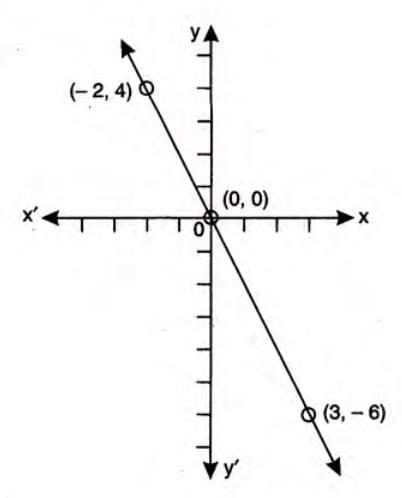
- Plot points (0, 0), (3, -6), (-2, 4) and draw a straight line through them.
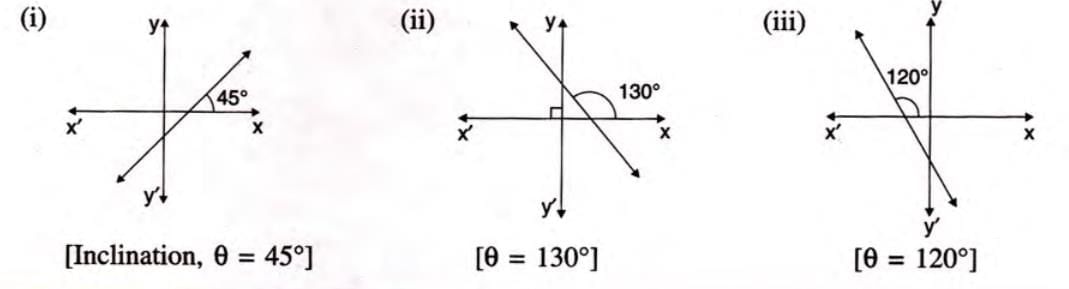
Inclination and Slope
- Inclination: The angle (θ) a line makes with the positive x-axis, measured anti-clockwise.
- Slope (m): Defined as m = tan θ, where θ is the inclination.
- Special cases:
- For x-axis or lines parallel to it: θ = 0°, so m = tan 0° = 0.
- For y-axis or lines parallel to it: θ = 90°, so m = tan 90° = undefined.
- Example: If a line’s inclination is 45°, then θ = 45°, and slope m = tan 45° = 1.
Y-Intercept
Y-intercept (c): The distance from the origin where a line crosses the y-axis.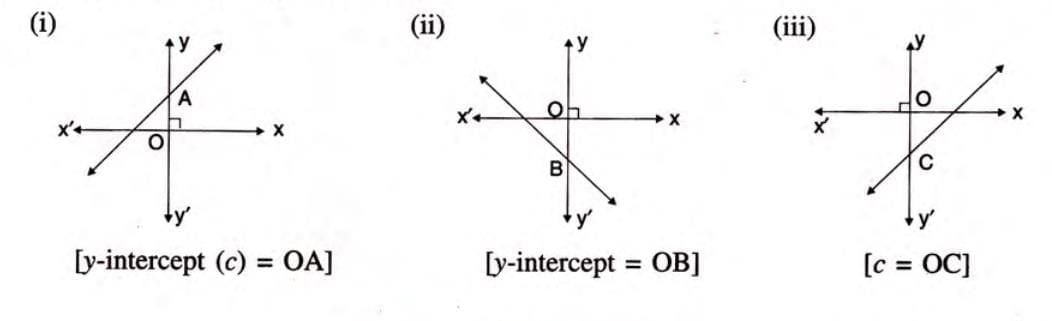
- Sign convention:
- Positive if the line crosses above the origin.
- Negative if the line crosses below the origin.
- Zero for the x-axis or lines parallel to the y-axis.
Example: For a line crossing the y-axis at (0, 5), the y-intercept c = 5 (positive).
Finding the Slope and the Y-Intercept of a Given Line
- Steps to find slope and y-intercept for a line ax + by + c = 0:
- Rearrange the equation to the form y = mx + c.
- Slope (m) = coefficient of x.
- Y-intercept (c) = constant term.
- Formula:
- For ax + by + c = 0:
- Slope (m) = -a/b
- Y-intercept (c) = -c/b
- Alternate method: Directly identify m and c after converting to y = mx + c.
Example: For 2x - 3y + 5 = 0:
- Rearrange: -3y = -2x - 5 → y = (2/3)x + 5/3.
- Slope m = 2/3.
- Y-intercept c = 5/3.
|
28 videos|171 docs|28 tests
|
FAQs on Co-ordinate Geometry Chapter Notes - Mathematics Class 9 ICSE
| 1. What are dependent and independent variables in coordinate geometry? |  |
| 2. How do you plot points on a Cartesian plane? | |
| 3. What are the four quadrants of the Cartesian plane, and how are they defined? | |
| 4. How do you graph a linear equation, and what does slope represent? | |
| 5. What is the significance of the graphs of x=0 and y=0? | |


ppt
,past year papers
,MCQs
,video lectures
,Viva Questions
,Sample Paper
,Semester Notes
,Free
,Important questions
,Exam
,Objective type Questions
,Summary
,Co-ordinate Geometry Chapter Notes | Mathematics Class 9 ICSE
,Extra Questions
,Co-ordinate Geometry Chapter Notes | Mathematics Class 9 ICSE
,Co-ordinate Geometry Chapter Notes | Mathematics Class 9 ICSE
,practice quizzes
,mock tests for examination
,study material
,shortcuts and tricks
,Previous Year Questions with Solutions
;


Chapter Notes: Co-ordinate Geometry Free PDF Download
Importance of Chapter Notes: Co-ordinate Geometry
Chapter Notes: Co-ordinate Geometry
Chapter Notes: Co-ordinate Geometry Class 9 Questions
Study Chapter Notes: Co-ordinate Geometry on the App
|
© EduRev
|
Education Revolution
|


|


