Graphical Solution Chapter Notes | Mathematics Class 9 ICSE PDF Download

Introduction
Imagine you're a detective solving a mystery where two clues must lead you to the same spot! In the world of mathematics, the "Graphical Solution" chapter is like that adventure. It teaches us how to use graphs to find solutions to linear equations and simultaneous equations. By plotting lines on a graph, we can see where they meet, revealing the answers to our equations. This chapter from Class 9 ICSE Mathematics makes learning fun by turning algebra into a visual puzzle, helping us understand how equations relate to lines and their intersections.
Graphs of Linear Equations in Two Variables
- A linear equation in two variables is written as ax + by + c = 0, where x and y are variables, and a, b, c are constants.
- The graph of such an equation is a straight line.
Steps to draw the graph of a linear equation ax + by + c = 0:
- Step 1: Rearrange the equation to make either x or y the subject.
- Step 2: Choose at least three values for the variable on the right-hand side and calculate the corresponding values of the other variable.
- Step 3: Create a table listing the pairs of x and y values.
- Step 4: Plot these points (ordered pairs) on graph paper.
- Step 5: Draw a straight line through the plotted points.
Special Cases:
- The equation of the x-axis is y = 0.
- The equation of the y-axis is x = 0.
- The graph of x = a (where a is a constant) is a straight line parallel to the y-axis, at a distance of a units from it.
- The graph of y = b (where b is a constant) is a straight line parallel to the x-axis, at a distance of b units from it.
Example:
Draw the graph of 3x + y - 4 = 0.
- Rearrange to make y the subject: y = -3x + 4.
- Choose three values for x and find y:
- For x = 1: y = -3 × 1 + 4 = 1.
- For x = -1: y = -3 × -1 + 4 = 7.
- For x = 0: y = -3 × 0 + 4 = 4.
- Create a table:

- Plot the points (1,1), (-1,7), and (0,4) on graph paper.
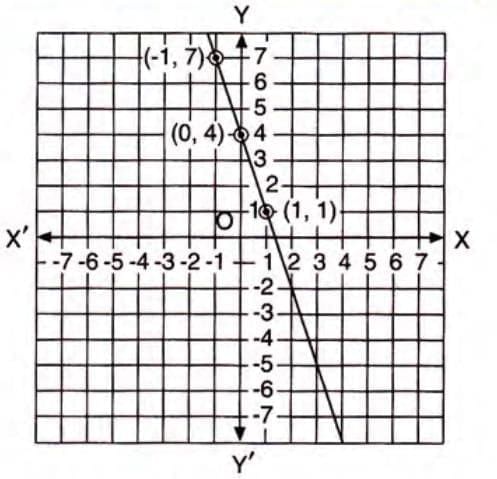
- Draw a straight line through these points to represent the equation.
Finding Unknowns Using Graphs:
- To find a variable’s value (e.g., a or b) from a table, plot the given points and draw the line.
- For a specific x-value, draw a vertical line to intersect the graph, then draw a horizontal line to the y-axis to find the corresponding y-value.
- For a specific y-value, draw a horizontal line to intersect the graph, then draw a vertical line to the x-axis to find the corresponding x-value.
Finding the Linear Relation:
- Assume the linear relation is y = mx + c, where m is the slope and c is the y-intercept.
- Use two points from the graph to substitute into y = mx + c and solve for m and c.
Example: Given the table: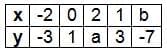
- Plot points (-2,-3), (0,1), and (1,3) on graph paper and draw a straight line.
- To find a: Draw a vertical line at x = 2 to intersect the graph, then a horizontal line to the y-axis, giving y = 5. So, a = 5.
- To find b: Draw a horizontal line at y = -7 to intersect the graph, then a vertical line to the x-axis, giving x = -4. So, b = -4.
- To find the linear relation, assume y = mx + c:
- Using point (0,1): 1 = m × 0 + c → c = 1.
- Using point (-2,-3): -3 = m × -2 + 1 → -4 = -2m → m = 2.
- Thus, the relation is y = 2x + 1.
Finding Coordinates Where the Graph Meets Axes:
- X-intercept: Set y = 0 in the equation and solve for x.
- Y-intercept: Set x = 0 in the equation and solve for y.
- Plot the line and verify the intercepts on the graph.
Calculating Area of Triangle Formed by Line and Axes:
- Find the x-intercept and y-intercept of the line.
- The triangle is formed by the origin (0,0), the x-intercept, and the y-intercept.
- Area = ½ × base × height, where base is the x-intercept and height is the y-intercept (or vice versa).
Example: Draw the graph of 2x - 3y + 12 = 0 and find the values of m and n for points (m,-2) and (3,n) on the line.
- Rearrange: 2x = 3y - 12 → x = (3y - 12)/2.
- Choose y-values and find x:
- For y = 0: x = (3 × 0 - 12)/2 = -6.
- For y = 2: x = (3 × 2 - 12)/2 = -3.
- For y = 4: x = (3 × 4 - 12)/2 = 0.
- Plot points (-6,0), (-3,2), and (0,4) and draw the line.
- For m: Draw a horizontal line at y = -2 to intersect the graph, then a vertical line to the x-axis at x = -9. So, m = -9.
- For n: Draw a vertical line at x = 3 to intersect the graph, then a horizontal line to the y-axis at y = 6. So, n = 6.
Solution of Simultaneous Linear Equations Graphically
- Simultaneous linear equations are two or more linear equations solved together to find common values of the variables.
- Graphically, the solution is the point where the lines intersect.
Steps to solve simultaneous linear equations graphically:
- Step 1: Draw the graph of each equation on the same graph paper.
- Step 2: Identify the coordinates of the point where the lines intersect.
- Step 3: The coordinates of the intersection point are the solution to the equations.
Example:
Solve graphically: 3x - 2y = 4 and 5x - 2y = 0.
For 3x - 2y = 4:
- Rearrange: 2y = 3x - 4 → y = (3x - 4)/2.
- Choose x-values:
- x = 0: y = (3 × 0 - 4)/2 = -2.
- x = 2: y = (3 × 2 - 4)/2 = 1.
- x = 6: y = (3 × 6 - 4)/2 = 7.
- Table:

- Rearrange: 2y = 5x → y = 5x/2.
- Choose x-values:
- x = -2: y = 5 × -2/2 = -5.
- x = 0: y = 5 × 0/2 = 0.
- x = 2: y = 5 × 2/2 = 5.
- Table:

- Plot both lines on the same graph paper.
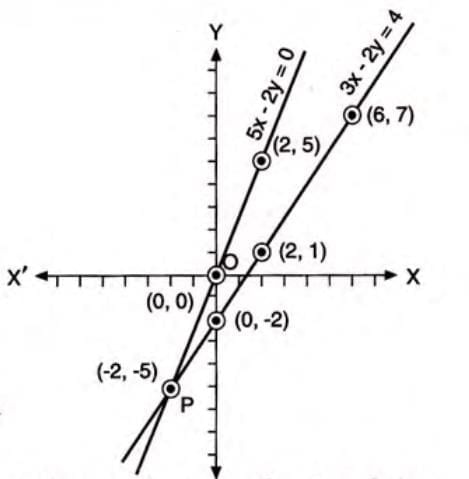
- The lines intersect at (-2,-5), so the solution is x = -2, y = -5.
Finding Area of Triangle Formed by Lines and X-Axis:
- Identify the intersection point of the two lines.
- Find the x-intercepts of both lines by setting y = 0.
- The triangle is formed by the intersection point and the x-intercepts.
- Calculate the base (distance between x-intercepts) and height (y-coordinate of the intersection).
- Area = ½ × base × height.
Example: Draw the graphs of 3x - y - 2 = 0 and 2x + y - 8 = 0. Find the intersection point and the area of the triangle formed with the x-axis.
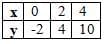
For 3x - y - 2 = 0:
- Rearrange: y = 3x - 2.
- Choose x-values:
- x = 0: y = 3 × 0 - 2 = -2.
- x = 2: y = 3 × 2 - 2 = 4.
- x = 4: y = 3 × 4 - 2 = 10.
- Table:
- Rearrange: y = 8 - 2x.
- Choose x-values:
- x = 0: y = 8 - 2 × 0 = 8.
- x = 2: y = 8 - 2 × 2 = 4.
- x = 4: y = 8 - 2 × 4 = 0.
- Table:

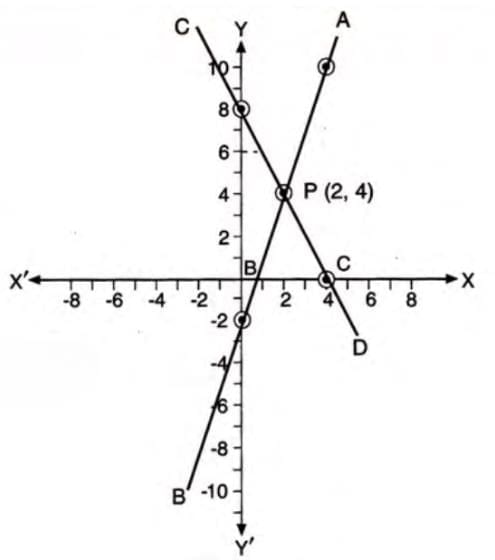
Plot both lines; they intersect at (2,4).
For the triangle:
- X-intercept of 3x - y - 2 = 0: Set y = 0 → 3x - 2 = 0 → x = 2/3.
- X-intercept of 2x + y - 8 = 0: Set y = 0 → 2x - 8 = 0 → x = 4.
- Base = 4 - 2/3 = 10/3.
- Height = y-coordinate of intersection = 4.
- Area = ½ × 10/3 × 4 = 20/3 square units.
Application in Real-Life Problems:
- Graphing can solve problems like finding the breakeven point in manufacturing, where cost equals revenue.
- Plot cost and selling price against the number of items to find where they intersect (breakeven).
- Profit or loss is found by comparing cost and selling price at specific quantities.
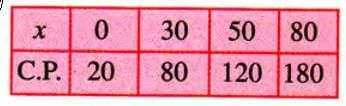
Example: In a factory, the cost of manufacturing x articles is ₹(20 + 2x), and the selling price is ₹2.5x. Draw graphs and find the breakeven point and profit for 60 articles.
- Cost (C.P.) = 20 + 2x:
- x = 0: C.P. = 20 + 2 × 0 = 20.
- x = 30: C.P. = 20 + 2 × 30 = 80.
- x = 50: C.P. = 20 + 2 × 50 = 120.
- x = 80: C.P. = 20 + 2 × 80 = 180.
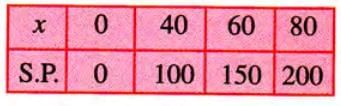
- Selling Price (S.P.) = 2.5x:
- x = 0: S.P. = 2.5 × 0 = 0.
- x = 40: S.P. = 2.5 × 40 = 100.
- x = 60: S.P. = 2.5 × 60 = 150.
- x = 80: S.P. = 2.5 × 80 = 200.
- Plot both graphs with 2 cm = 10 articles on x-axis and 2 cm = ₹20 on y-axis.
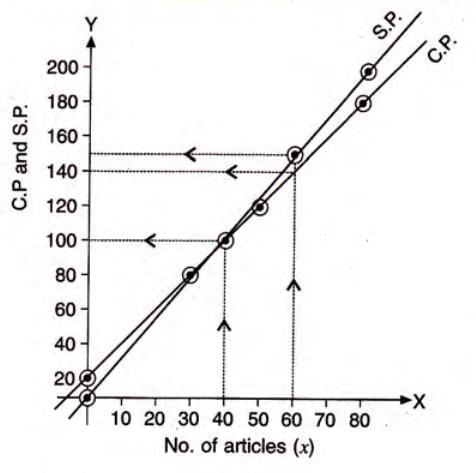
- Breakeven point: Lines intersect at x = 40, so 40 articles.
- Profit at x = 60: Draw a vertical line at x = 60; C.P. = ₹140, S.P. = ₹150. Profit = 150 - 140 = ₹10.
|
28 videos|171 docs|28 tests
|
FAQs on Graphical Solution Chapter Notes - Mathematics Class 9 ICSE
| 1. What is a linear equation in two variables? |  |
| 2. How can we graph a linear equation in two variables? | |
| 3. What is the significance of the solution of simultaneous linear equations? | |
| 4. How do we find the solution of simultaneous linear equations graphically? | |
| 5. What are some real-life applications of linear equations in two variables? | |


Graphical Solution Chapter Notes | Mathematics Class 9 ICSE
,Exam
,mock tests for examination
,study material
,shortcuts and tricks
,Previous Year Questions with Solutions
,Important questions
,Summary
,Graphical Solution Chapter Notes | Mathematics Class 9 ICSE
,Sample Paper
,Free
,ppt
,practice quizzes
,Semester Notes
,past year papers
,Graphical Solution Chapter Notes | Mathematics Class 9 ICSE
,video lectures
,Extra Questions
,Objective type Questions
,Viva Questions
,MCQs
;


Chapter Notes: Graphical Solution Free PDF Download
Importance of Chapter Notes: Graphical Solution
Chapter Notes: Graphical Solution
Chapter Notes: Graphical Solution Class 9 Questions
Study Chapter Notes: Graphical Solution on the App
|
© EduRev
|
Education Revolution
|


|


within 7 days!