Class 6 Exam > Class 6 Notes > Mathematics Class 6 ICSE > Chapter Notes: Data Handling
Data Handling Chapter Notes | Mathematics Class 6 ICSE PDF Download
| Table of contents |
|
| Introduction |
|
| Data |
|
| Collecting Data |
|
| Organizing Data |
|
| Pictograph |
|
| Bar Graphs |
|
| Measures of Central Tendency |
|
| Solved Examples |
|

Introduction
Data is all around us, like a treasure chest of information waiting to be explored! From teachers tracking student progress to doctors noting patient details, data helps us understand patterns, make decisions, and plan for the future. Imagine it as a way to organize the world’s stories in numbers, pictures, or charts. In this chapter, we’ll dive into how to collect, organize, and represent data using tools like tally marks, pictographs, and bar graphs, and learn how to find central values like mean and median to summarize data in a meaningful way.
Data
- Data is a collection of information, usually in the form of numbers, that helps us understand and make decisions.
- It’s used by teachers (student records), doctors (patient health), police (crime data), and weather departments (forecasts).
- Data can be organised and shown in different ways, like tables or graphs, to make it easier to understand.
Example: A class teacher asks students to pick a trip destination from Shimla, Manali, Kashmir, or Agra. The class monitor lists the choices to summarise how many students prefer each place. This list is a form of data collection that helps the teacher plan the trip.
Collecting Data
- Collecting data means gathering information systematically, like asking people questions or recording observations.
- Grouping similar data together makes it easier to count and analyse.
- Steps to Collect Data:
- Identify what information you need (e.g., favourite destinations).
- Ask or observe to gather responses.
- Group similar responses to simplify counting.
Example: A teacher asks students to choose a trip destination. The class monitor groups students by their choices (e.g., Kashmir, Manali) to count how many prefer each place. Grouping helps count faster and avoid mistakes.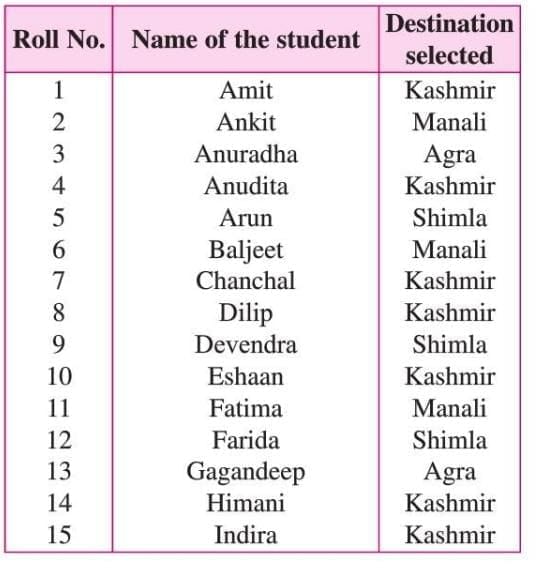
Organizing Data
- Organising data means arranging it clearly, often using tables or tally marks.
- Tally marks represent data: each unit is shown by ‘|’ and a group of 5 by
 (a crossbar over four lines).
 - Steps to Organize Data:
- List categories (e.g., destinations).
- Mark each response with a tally mark in the correct category.
- Count tally marks to find the total for each category.
Example: For the trip destination data, the monitor uses tally marks:
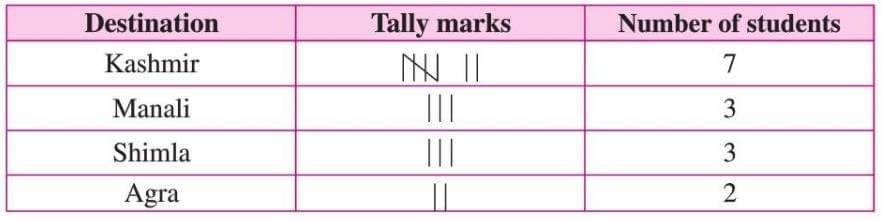 Tally marks make it easy to count students per destination.
Tally marks make it easy to count students per destination.Pictograph
- A pictograph uses pictures or symbols to represent data, making it visually appealing.
- Each symbol stands for a specific number, explained in a key.
- Pictographs help compare data quickly and clearly.
- Steps to Create a Pictograph:
- Choose a symbol to represent a unit of data.
- Draw the correct number of symbols for each category based on the data.
- Include a key to explain what each symbol means.
Example: A survey shows students’ favourite fruits:
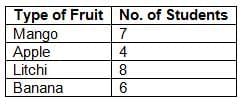 In a pictograph, each fruit symbol represents 1 student, so Mango has 7 symbols, Apple has 4, and so on.
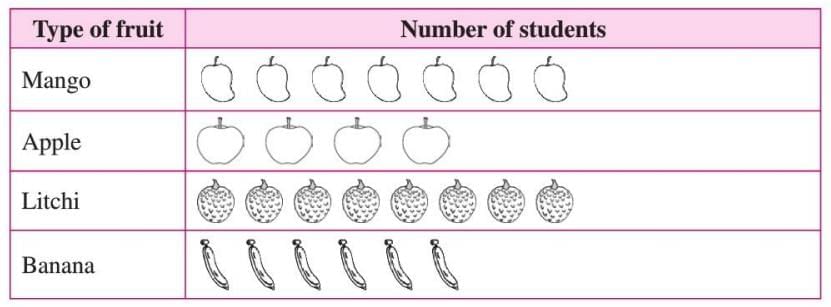
In a pictograph, each fruit symbol represents 1 student, so Mango has 7 symbols, Apple has 4, and so on.Bar Graphs
- Bar graphs use rectangular bars to show data, with bar height or length showing the frequency.
- Bars are of equal width and spaced evenly for clarity.
- Steps to Construct a Bar Graph:
- Draw two perpendicular lines: one horizontal (x-axis), one vertical (y-axis).
- Choose a scale (e.g., 1 unit = 2000 bicycles) for the axis showing numerical values.
- Draw bars of equal width, with heights matching the data according to the scale.
- Properties of Bar Graphs:
- Bars can be horizontal or vertical.
- Bar height or length shows the data value.
- All bars have the same width for consistency.
- Equal spacing between bars makes the graph clear.
- Bars can be shaded or colored for visual appeal.
Example: Number of students present in a class during a week:
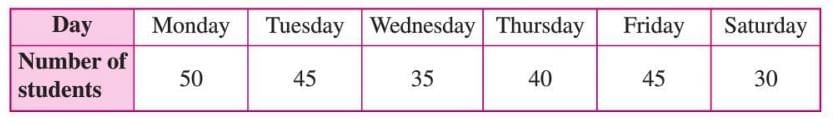 A bar graph shows bars for each day, with heights matching the number of students (e.g., 50 for Monday).
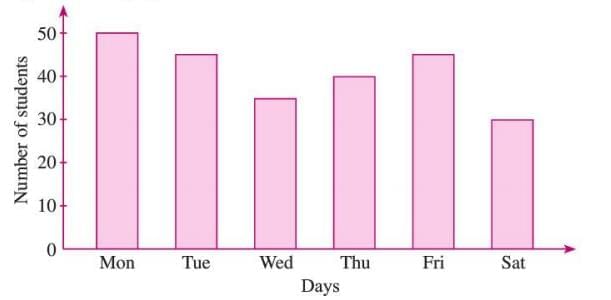
A bar graph shows bars for each day, with heights matching the number of students (e.g., 50 for Monday).Measures of Central Tendency
- Central tendencies are single values that represent the centre of a data set.
- The three types are mean, median, and mode, each summarising data differently.
Arithmetic Mean
- The arithmetic mean (or average) is the sum of all data values divided by the number of values.
- Formula: Mean = (Sum of all observations) / (Total number of observations)
- Steps to Calculate Mean:
- Add all the data values.
- Count the number of values.
- Divide the sum by the count.
Example: Pratibha studied for 3, 4, 7, and 2 hours over four days. Mean = (3 + 4 + 7 + 2) / 4 = 16 / 4 = 4 hours per day.
Median
- The median is the middle value when data is arranged in order.
- It’s not affected by extreme values, unlike the mean.
- Steps to Calculate Median:
- Arrange data in ascending or descending order.
- If the number of observations (n) is odd, median is the ((n + 1) / 2)th value.
- If n is even, median is the average of (n / 2)th and ((n / 2) + 1)th values.
- Formula:
- For odd n: Median = ((n + 1) / 2)th observation
- For even n: Median = [(n / 2)th observation + ((n / 2) + 1)th observation] / 2
Example: Ages of 7 men: 45, 54, 28, 32, 65, 47, 35. Arranged: 28, 32, 35, 45, 47, 54, 65. Since n = 7 (odd), median = (7 + 1) / 2 = 4th value = 45.
Solved Examples
Example 1: Organising Data
In a Mathematics test, marks of 40 students are given. Arrange in a table using tally marks and find:
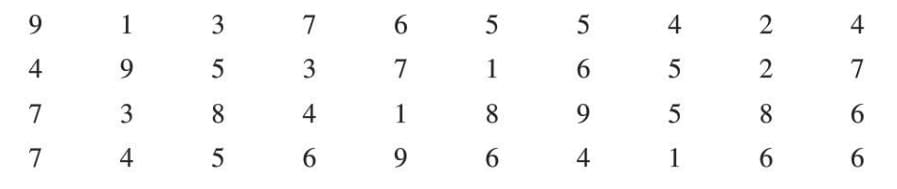 (a) students with 8 or more marks, (b) students with less than 4 marks, (c) students with the highest marks.
Solution: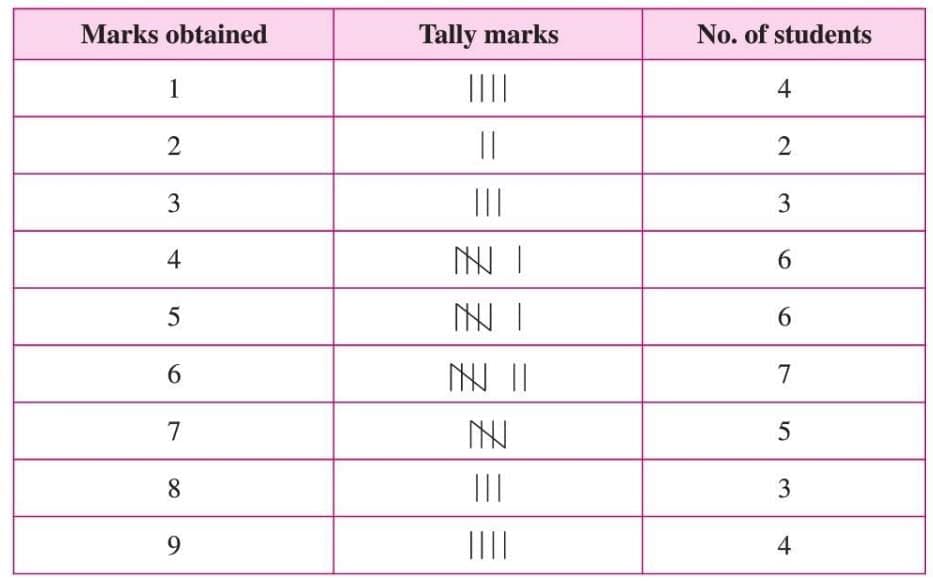 (a) 8 or more marks: 3 (8) + 4 (9) = 7 students.
(b) Less than 4 marks: 4 (1) + 2 (2) + 3 (3) = 9 students.
(c) Highest marks (9): 4 students.
In a Mathematics test, marks of 40 students are given. Arrange in a table using tally marks and find:
(a) students with 8 or more marks, (b) students with less than 4 marks, (c) students with the highest marks.Solution:
(a) 8 or more marks: 3 (8) + 4 (9) = 7 students.(b) Less than 4 marks: 4 (1) + 2 (2) + 3 (3) = 9 students.
(c) Highest marks (9): 4 students.
Example 2: Pictograph
Number of cows in five villages:
A (70), B (100), C (80), D (60), E (50).
Create a pictograph using a circle for 10 cows and answer:
(a) symbols for village A,
(b) village with maximum cows,
(c) difference between A and D,
(d) represent 35 cows.
Solution: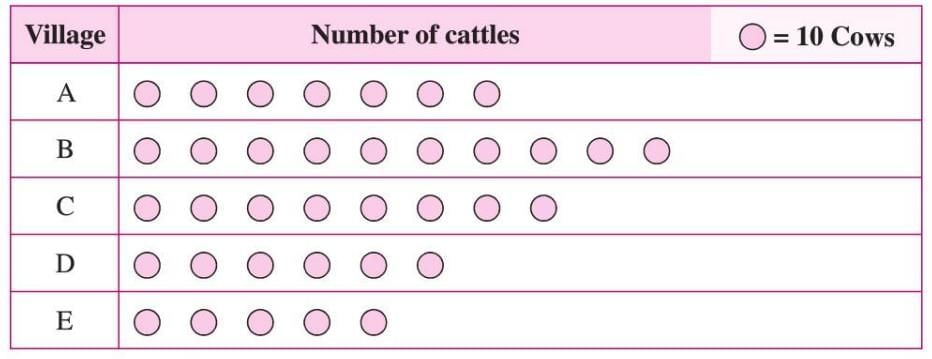 (a) Village A: 70 ÷ 10 = 7 circles.
(b) Village B has the maximum (100 cows).
(c) A (70) - D (60) = 10 cows.
(d) 35 cows = 3 full circles and 1 half circle.
Number of cows in five villages:
A (70), B (100), C (80), D (60), E (50).
Create a pictograph using a circle for 10 cows and answer:
(a) symbols for village A,
(b) village with maximum cows,
(c) difference between A and D,
(d) represent 35 cows.
Solution:
(a) Village A: 70 ÷ 10 = 7 circles.(b) Village B has the maximum (100 cows).
(c) A (70) - D (60) = 10 cows.
(d) 35 cows = 3 full circles and 1 half circle.
Example 3: Bar Graph
Bicycles manufactured from 2014 to 2018: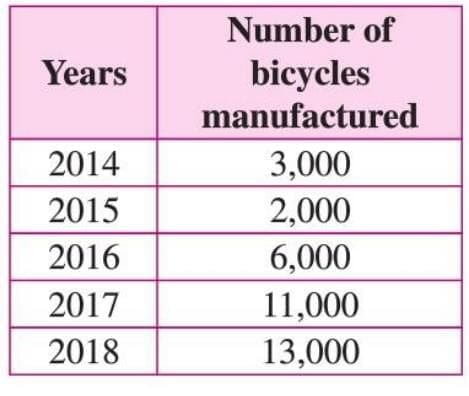 Use scale 1 unit = 2000 bicycles. Find:
(a) year with maximum bicycles,
(b) year with minimum bicycles.
Solution: Draw bars with heights: 2014 (1.5 units), 2015 (1 unit), 2016 (3 units), 2017 (5.5 units), 2018 (6.5 units).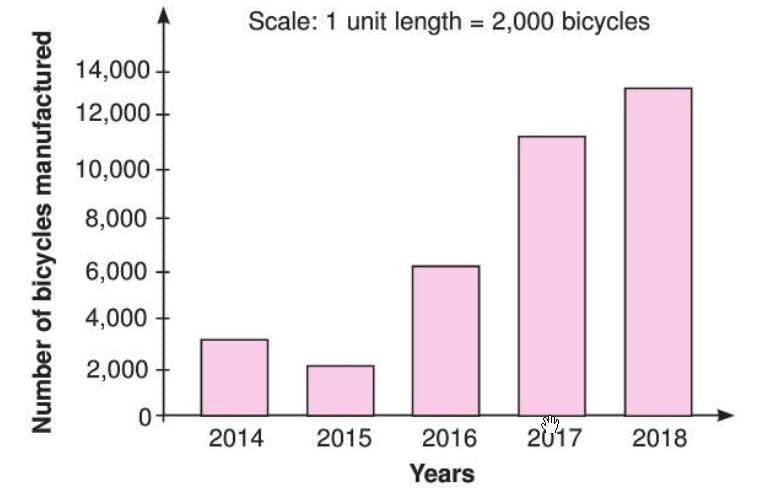 (a) 2018 (13000 bicycles).
(b) 2015 (2000 bicycles).
Bicycles manufactured from 2014 to 2018:
Use scale 1 unit = 2000 bicycles. Find: (a) year with maximum bicycles,
(b) year with minimum bicycles.
Solution: Draw bars with heights: 2014 (1.5 units), 2015 (1 unit), 2016 (3 units), 2017 (5.5 units), 2018 (6.5 units).
(a) 2018 (13000 bicycles).(b) 2015 (2000 bicycles).
The document Data Handling Chapter Notes | Mathematics Class 6 ICSE is a part of the Class 6 Course Mathematics Class 6 ICSE.
All you need of Class 6 at this link: Class 6
|
44 videos|201 docs|24 tests
|
FAQs on Data Handling Chapter Notes - Mathematics Class 6 ICSE
| 1. What is the importance of collecting data in mathematics? |  |
Ans. Collecting data is crucial in mathematics as it provides the necessary information to analyze and draw conclusions. It helps in understanding trends, making predictions, and supporting decision-making processes. In statistics, the quality of the analysis is heavily dependent on the accuracy and relevance of the collected data.
| 2. How can data be organized effectively? | |
Ans. Data can be organized effectively by categorizing it into meaningful groups or classes. This can be done using tables, charts, or graphs, which allow for easier interpretation and analysis. Organizing data helps in identifying patterns and relationships within the data set, making it more manageable for further analysis.
| 3. What is a pictograph and how is it used? | |
Ans. A pictograph is a visual representation of data using pictures or symbols to represent quantities. It is used to convey information quickly and clearly, allowing viewers to grasp the data at a glance. Pictographs are particularly useful for presenting simple data sets, especially in educational contexts where visual learning aids comprehension.
| 4. What are bar graphs and how do they differ from pictographs? | |
Ans. Bar graphs are charts that use rectangular bars to represent data values. The length of each bar corresponds to the quantity it represents. Unlike pictographs, which use images or symbols, bar graphs provide a more precise method of displaying numerical data. Bar graphs are useful for comparing different groups or categories clearly and effectively.
| 5. What are measures of central tendency and why are they important? | |
Ans. Measures of central tendency include the mean, median, and mode, which summarize a data set by identifying the center point or typical value. They are important because they provide a quick summary of a large data set, helping to understand its overall trend or tendency. These measures are essential in statistics for comparing different data sets and making informed decisions based on the data.
About this Document

4.64/5
Rating

Oct 02, 2025
Last updated
Related Exams
Document Description: Chapter Notes: Data Handling for Class 6 2025 is part of Mathematics Class 6 ICSE preparation.
The notes and questions for Chapter Notes: Data Handling have been prepared according to the Class 6 exam syllabus. Information about Chapter Notes: Data Handling covers topics
like Introduction, Data, Collecting Data, Organizing Data, Pictograph, Bar Graphs, Measures of Central Tendency, Solved Examples and Chapter Notes: Data Handling Example, for Class 6 2025 Exam. Find important definitions, questions, notes, meanings, examples, exercises and tests below for Chapter Notes: Data Handling.
Introduction of Chapter Notes: Data Handling in English is available as part of our Mathematics Class 6 ICSE
for Class 6 & Chapter Notes: Data Handling in Hindi for Mathematics Class 6 ICSE course.
Download more important topics related with notes, lectures and mock test series for Class 6
Exam by signing up for free. Class 6: Data Handling Chapter Notes | Mathematics Class 6 ICSE
Description
Full syllabus notes, lecture & questions for Data Handling Chapter Notes | Mathematics Class 6 ICSE - Class 6 | Plus excerises question with solution to help you revise complete syllabus for Mathematics Class 6 ICSE | Best notes, free PDF download
Information about Chapter Notes: Data Handling
In this doc you can find the meaning of Chapter Notes: Data Handling defined & explained in the simplest way possible. Besides explaining types of
Chapter Notes: Data Handling theory, EduRev gives you an ample number of questions to practice Chapter Notes: Data Handling tests, examples and also practice Class 6
tests

Related Searches
Sample Paper
,mock tests for examination
,Semester Notes
,Data Handling Chapter Notes | Mathematics Class 6 ICSE
,video lectures
,Extra Questions
,MCQs
,Important questions
,Objective type Questions
,ppt
,Data Handling Chapter Notes | Mathematics Class 6 ICSE
,Exam
,past year papers
,Viva Questions
,Summary
,Previous Year Questions with Solutions
,Data Handling Chapter Notes | Mathematics Class 6 ICSE
,shortcuts and tricks
,Free
,study material
,practice quizzes
;


Additional Information about Chapter Notes: Data Handling for Class 6 Preparation
Chapter Notes: Data Handling Free PDF Download
The Chapter Notes: Data Handling is an invaluable resource that delves deep into the core of the Class 6 exam.
These study notes are curated by experts and cover all the essential topics and concepts, making your preparation more efficient and effective.
With the help of these notes, you can grasp complex subjects quickly, revise important points easily,
and reinforce your understanding of key concepts. The study notes are presented in a concise and easy-to-understand manner,
allowing you to optimize your learning process. Whether you're looking for best-recommended books, sample papers, study material,
or toppers' notes, this PDF has got you covered. Download the Chapter Notes: Data Handling now and kickstart your journey towards success in the Class 6 exam.
Importance of Chapter Notes: Data Handling
The importance of Chapter Notes: Data Handling cannot be overstated, especially for Class 6 aspirants.
This document holds the key to success in the Class 6 exam.
It offers a detailed understanding of the concept, providing invaluable insights into the topic.
By knowing the concepts well in advance, students can plan their preparation effectively.
Utilize this indispensable guide for a well-rounded preparation and achieve your desired results.
Chapter Notes: Data Handling
Chapter Notes: Data Handling Notes offer in-depth insights into the specific topic to help you master it with ease.
This comprehensive document covers all aspects related to Chapter Notes: Data Handling.
It includes detailed information about the exam syllabus, recommended books, and study materials for a well-rounded preparation.
Practice papers and question papers enable you to assess your progress effectively.
Additionally, the paper analysis provides valuable tips for tackling the exam strategically.
Access to Toppers' notes gives you an edge in understanding complex concepts.
Whether you're a beginner or aiming for advanced proficiency, Chapter Notes: Data Handling Notes on EduRev are your ultimate resource for success.
Chapter Notes: Data Handling Class 6 Questions
The "Chapter Notes: Data Handling Class 6 Questions" guide is a valuable resource for all aspiring students preparing for the
Class 6 exam. It focuses on providing a wide range of practice questions to help students gauge
their understanding of the exam topics. These questions cover the entire syllabus, ensuring comprehensive preparation.
The guide includes previous years' question papers for students to familiarize themselves with the exam's format and difficulty level.
Additionally, it offers subject-specific question banks, allowing students to focus on weak areas and improve their performance.
Study Chapter Notes: Data Handling on the App
Students of Class 6 can study Chapter Notes: Data Handling alongwith tests & analysis from the EduRev app,
which will help them while preparing for their exam. Apart from the Chapter Notes: Data Handling,
students can also utilize the EduRev App for other study materials such as previous year question papers, syllabus, important questions, etc.
The EduRev App will make your learning easier as you can access it from anywhere you want.
The content of Chapter Notes: Data Handling is prepared as per the latest Class 6 syllabus.
|
© EduRev
|
Education Revolution
|


|


Signup to see your scores
go up
within 7 days!
within 7 days!
Takes less than 10 seconds to signup