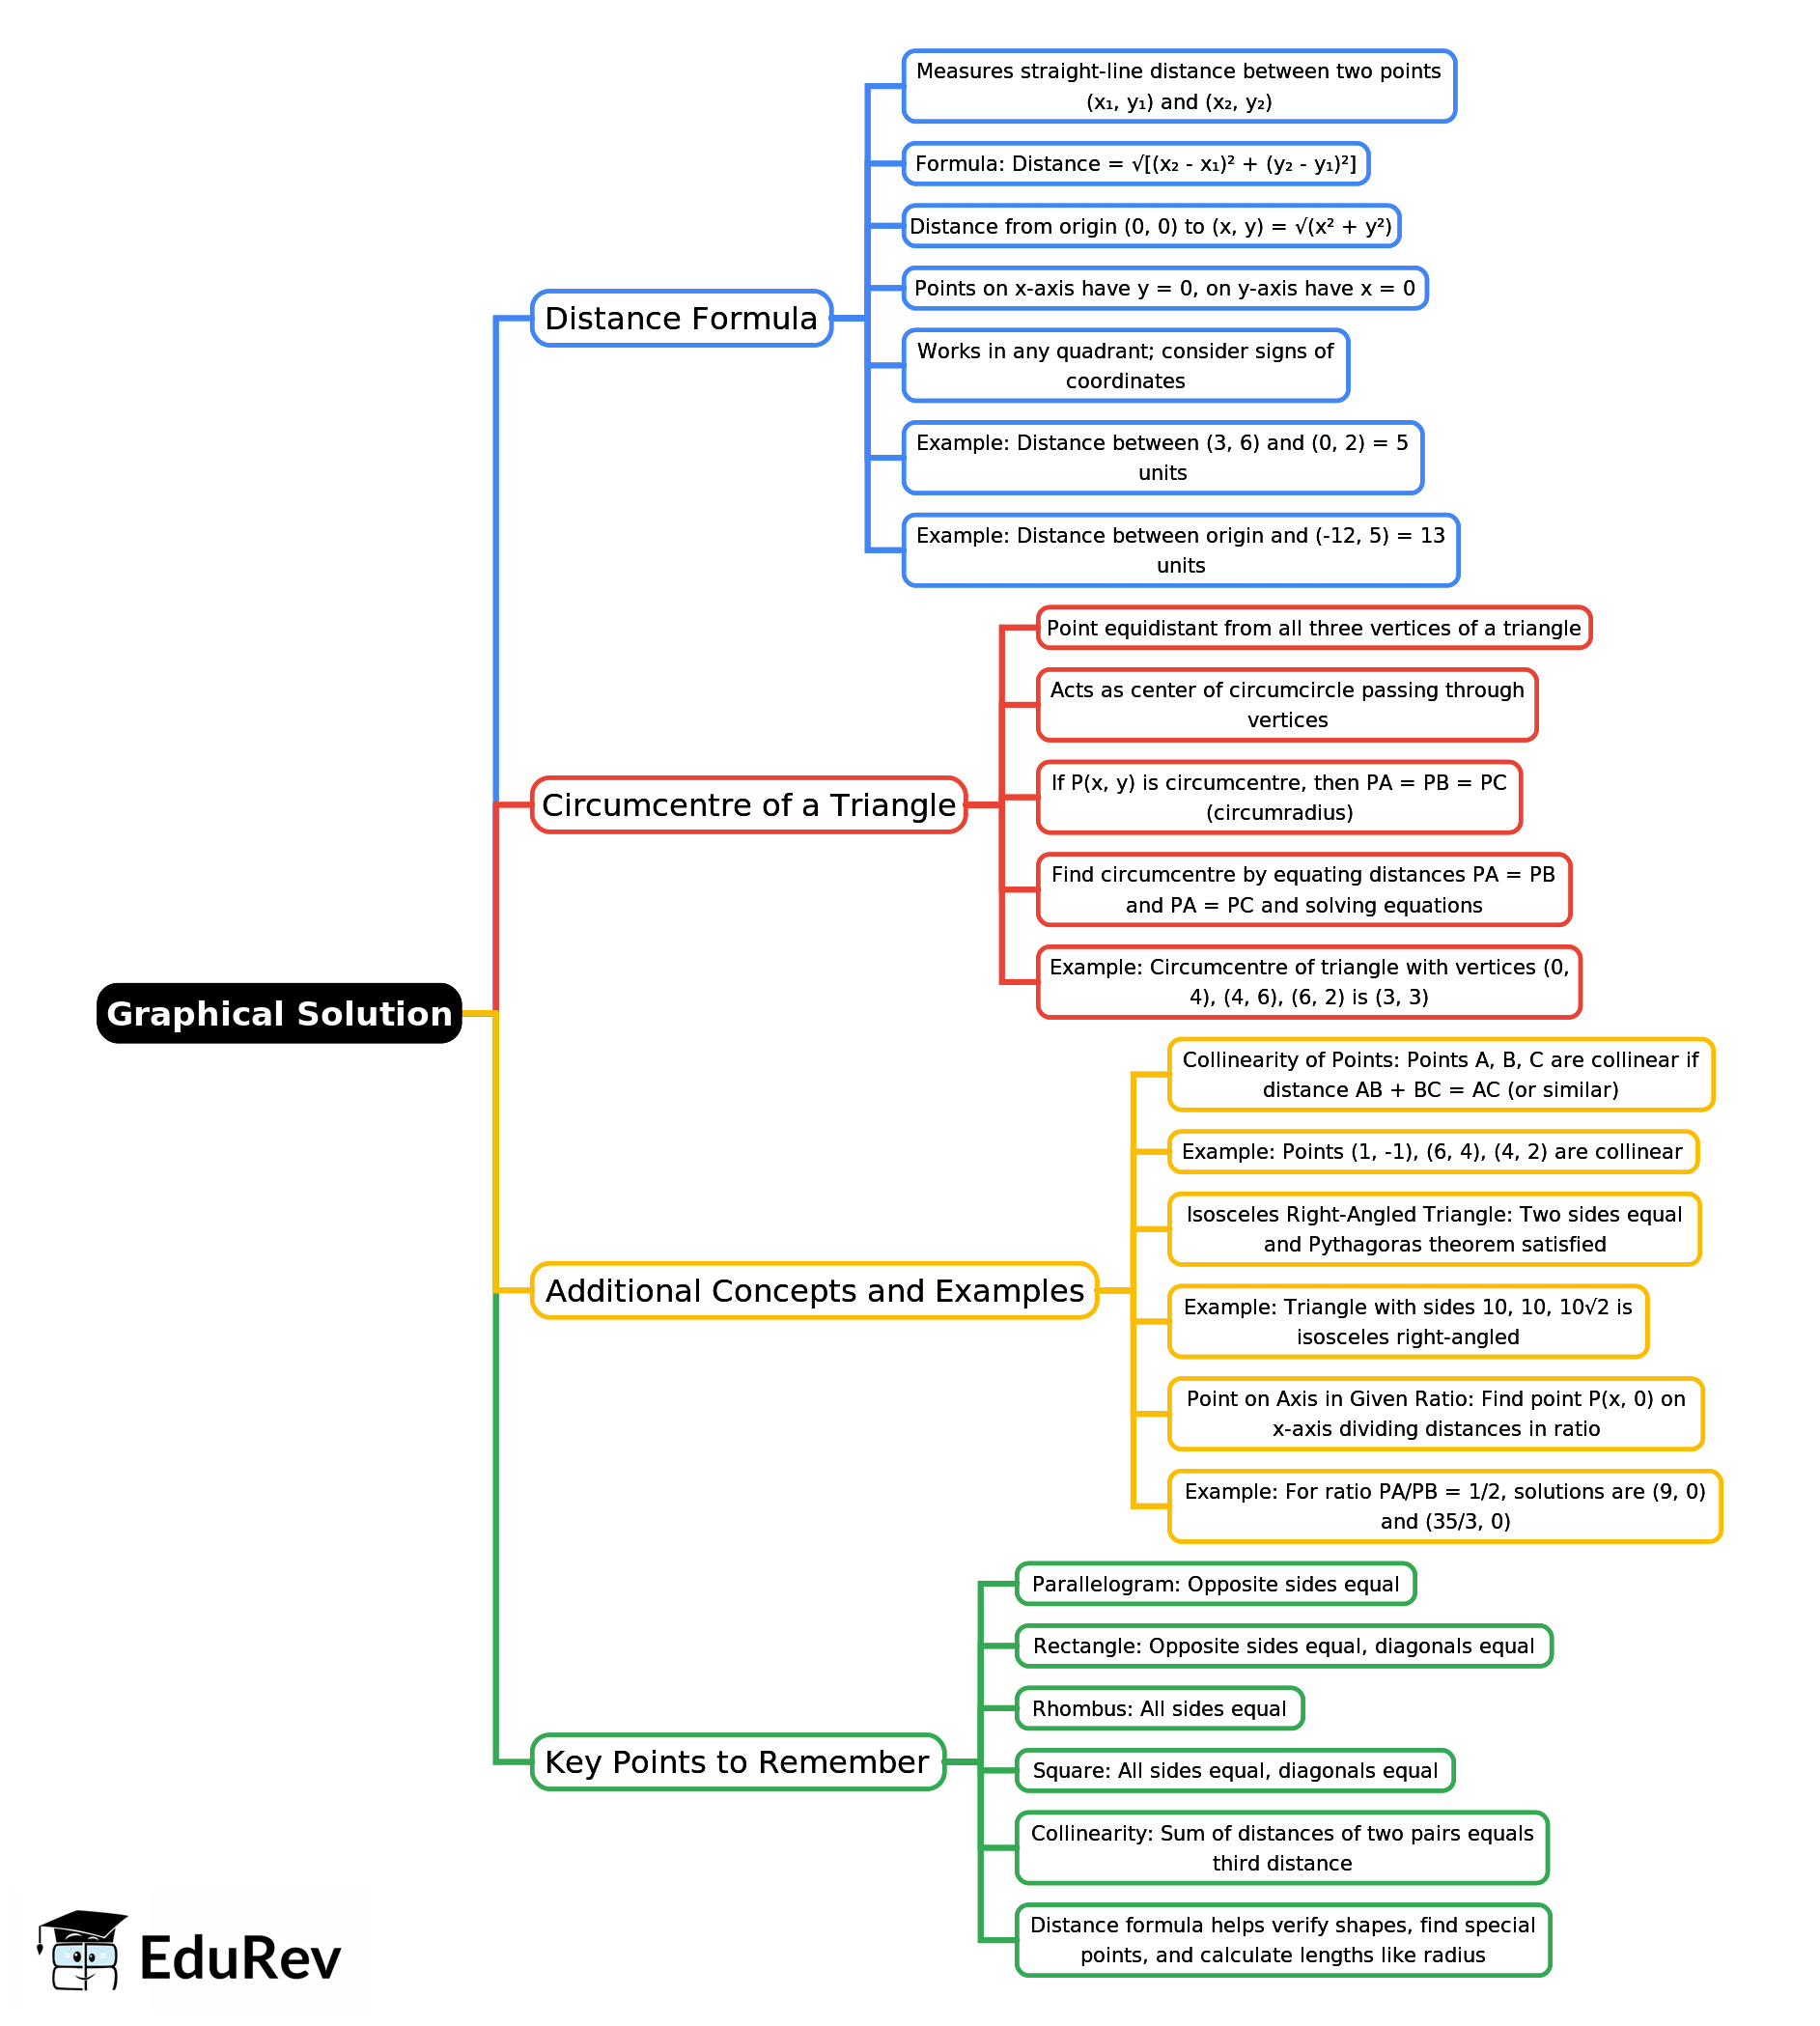
Class 9 Exam > Class 9 Notes > Mathematics Class 9 ICSE > Mind Map: Distance Formula
Mind Map: Distance Formula | Mathematics Class 9 ICSE PDF Download

The document Mind Map: Distance Formula | Mathematics Class 9 ICSE is a part of the Class 9 Course Mathematics Class 9 ICSE.
All you need of Class 9 at this link: Class 9
|
28 videos|171 docs|28 tests
|
FAQs on Mind Map: Distance Formula - Mathematics Class 9 ICSE
| 1. What is a graphical solution in the context of mathematics? |  |
Ans. A graphical solution refers to the method of solving mathematical problems by representing equations or inequalities on a graph. This visual approach allows one to find the points of intersection, which represent the solution to the equations. For example, in a system of linear equations, the point where the two lines intersect is the solution to the equations.
| 2. How do you represent linear equations graphically? |  |
Ans. To represent linear equations graphically, one needs to convert the equations into slope-intercept form (y = mx + b) or standard form (Ax + By = C). Once in the correct form, you can plot the y-intercept (b) on the y-axis and use the slope (m) to find another point on the line. Finally, you connect the points with a straight line, which represents the equation graphically.
| 3. What are the steps involved in solving a system of equations graphically? |  |
Ans. The steps to solve a system of equations graphically include:
1. Convert each equation to a suitable form if necessary.
2. Plot each equation on the same set of axes.
3. Identify the points of intersection of the lines.
4. The coordinates of the intersection point(s) provide the solution(s) to the system of equations.
| 4. What are the advantages of using graphical methods to solve equations? |  |
Ans. The advantages of using graphical methods include:
1. Visual representation: Graphs provide an intuitive understanding of the relationships between variables.
2. Easy to identify solutions: Intersection points clearly indicate solutions.
3. Useful for inequalities: Graphing allows for easy visualization of solutions to inequalities, showcasing feasible regions.
| 5. Can graphical solutions be used for non-linear equations? |  |
Ans. Yes, graphical solutions can be used for non-linear equations as well. By plotting the curves on a graph, one can visually determine the points where they intersect, which represent the solutions to the equations. However, the complexity of the curves may require more careful analysis compared to linear equations.
Related Searches


