Practice Question - 15 (Venn Diagram) | 100 DILR Questions for CAT Preparation PDF Download

Students in a college are discussing two proposals -
A: a proposal by the authorities to introduce dress code on campus, and
B: a proposal by the students to allow multinational food franchises to set up outlets on college campus.
A student does not necessarily support either of the two proposals.
In an upcoming election for student union president, there are two candidates in fray:
Sunita and Ragini. Every student prefers one of the two candidates.
A survey was conducted among the students by picking a sample of 500 students. The following information was noted from this survey.
1. 250 students supported proposal A and 250 students supported proposal B.
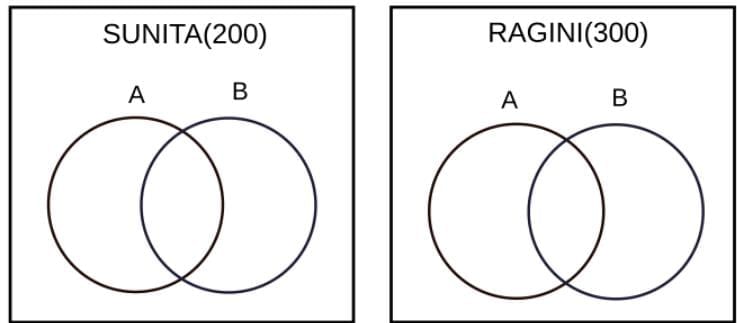
2. Among the 200 students who preferred Sunita as student union president, 80% supported proposal A.
3. Among those who preferred Ragini, 30% supported proposal A.
4. 20% of those who supported proposal B preferred Sunita.
5. 40% of those who did not support proposal B preferred Ragini.
6. Every student who preferred Sunita and supported proposal B also supported proposal A.
7. Among those who preferred Ragini, 20% did not support any of the proposals.
Q1: Among the students surveyed who supported proposal A, what percentage preferred Sunita for student union president?
 View Answer
Ans: 64
Total number of students surveyed = 500
Every student prefers one of the two candidates. Ragini(R) and Sunita(S).
Thus, R+S=500.
According to statement 2, "Among the 200 students who preferred Sunita as student union president, 80% supported proposal A."
The number of students who support Sunita(S)=200
The number of students who supported Ragini(R)=300
According to statements 2 and 3, 160 students who supported Sunita also supported the proposal A & 90 students who supported Ragini also supported proposal A.
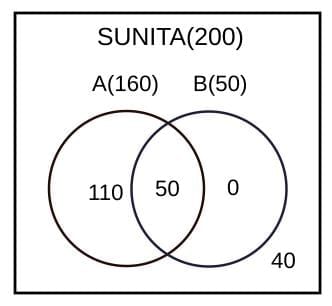
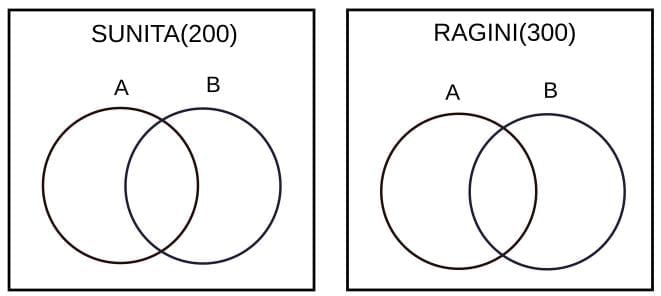
According to statements 4 and 6, we can make the following Venn diagram for Sunita.

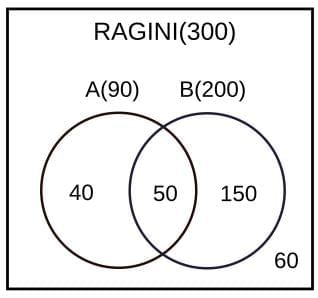
According to statement 5 and 7, we can make the following Venn diagram.

The number of students who preferred Sunita and the proposal A=160
=160/250= 64%
Q2: What percentage of the students surveyed who did not support proposal A preferred Ragini as student union president?
View Answer Ans: 84
Total number of students surveyed= 500
Every student prefers one of the two candidates. Ragini(R) and Sunita(S).
Thus, R+S=500.
According to statement 2, "Among the 200 students who preferred Sunita as student union president, 80% supported proposal A."
The number of students who support Sunita(S)=200
The number of students who supported Ragini(R)=300

According to statements 2 and 3, 160 students who supported Sunita also supported the proposal A & 90 students who supported Ragini also supported proposal A.
According to statements 4 and 6, we can make the following Venn diagram for Sunita.
According to statement 5 and 7, we can make the following Venn diagram.

The percentage of the students surveyed who did not support proposal A preferred Ragini as student union president = 210/250 = 84%
Answer 84
Q3: What percentage of the students surveyed who supported both proposals A and B preferred Sunita as student union president?
(a) 40
(b) 25
(c) 20
(d) 50
View Answer Ans: (d)
Total number of students surveyed= 500
Every student prefers one of the two candidates. Ragini(R) and Sunita(S).
Thus, R + S = 500.
According to statement 2, "Among the 200 students who preferred Sunita as student union president, 80% supported proposal A."
The number of students who support Sunita(S)=200
The number of students who supported Ragini(R)=300
According to statements 2 and 3, 160 students who supported Sunita also supported the proposal A & 90 students who supported Ragini also supported proposal A.
According to statements 4 and 6, we can make the following Venn diagram for Sunita.

According to statement 5 and 7, we can make the following Venn diagram.
According to the Venn diagram, the students surveyed who supported both proposals A and B preferred Sunita as student union president 
Q4: How many of the students surveyed supported proposal B, did not support proposal A and preferred Ragini as student union president?
(a) 150
(b) 210
(c) 200
(d) 40
View Answer Ans: (a)
Total number of students surveyed= 500
Every student prefers one of the two candidates. Ragini(R) and Sunita(S).
Thus, R + S = 500.
According to statement 2, "Among the 200 students who preferred Sunita as student union president, 80% supported proposal A."
The number of students who support Sunita(S)=200
The number of students who supported Ragini(R)=300

According to statements 2 and 3, 160 students who supported Sunita also supported the proposal A & 90 students who supported Ragini also supported proposal A.
According to statements 4 and 6, we can make the following Venn diagram for Sunita.

According to statement 5 and 7, we can make the following Venn diagram.

From the diagram, we can understand that option (a) is correct.
|
102 videos|123 docs|121 tests
|
FAQs on Practice Question - 15 (Venn Diagram) - 100 DILR Questions for CAT Preparation
| 1. What is a Venn diagram and how is it used in problem-solving? |  |
| 2. What types of questions can be solved using Venn diagrams in exams? | |
| 3. How can I effectively interpret Venn diagrams during exams? | |
| 4. What are some common mistakes to avoid when using Venn diagrams? | |
| 5. Can Venn diagrams be applied to real-life situations outside of exams? | |


Exam
,Extra Questions
,shortcuts and tricks
,Summary
,past year papers
,practice quizzes
,Practice Question - 15 (Venn Diagram) | 100 DILR Questions for CAT Preparation
,Important questions
,Objective type Questions
,Sample Paper
,ppt
,Practice Question - 15 (Venn Diagram) | 100 DILR Questions for CAT Preparation
,Semester Notes
,Free
,Practice Question - 15 (Venn Diagram) | 100 DILR Questions for CAT Preparation
,Previous Year Questions with Solutions
,study material
,Viva Questions
,video lectures
,mock tests for examination
,MCQs
;


Practice Question - 15 (Venn Diagram) Free PDF Download
Importance of Practice Question - 15 (Venn Diagram)
Practice Question - 15 (Venn Diagram) Notes
Practice Question - 15 (Venn Diagram) CAT Questions
Study Practice Question - 15 (Venn Diagram) on the App
|
© EduRev
|
Education Revolution
|


|


