Practice Question - 31 (Quant Based DI) | 100 DILR Questions for CAT Preparation PDF Download

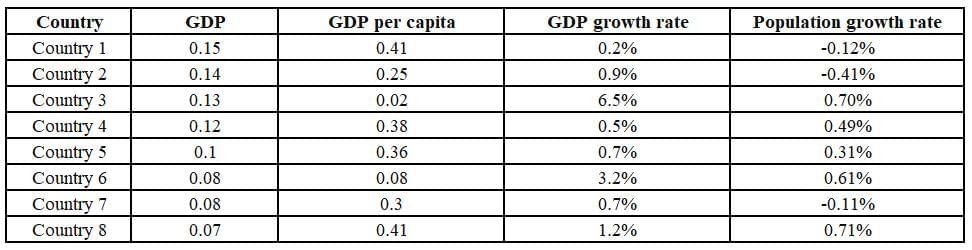
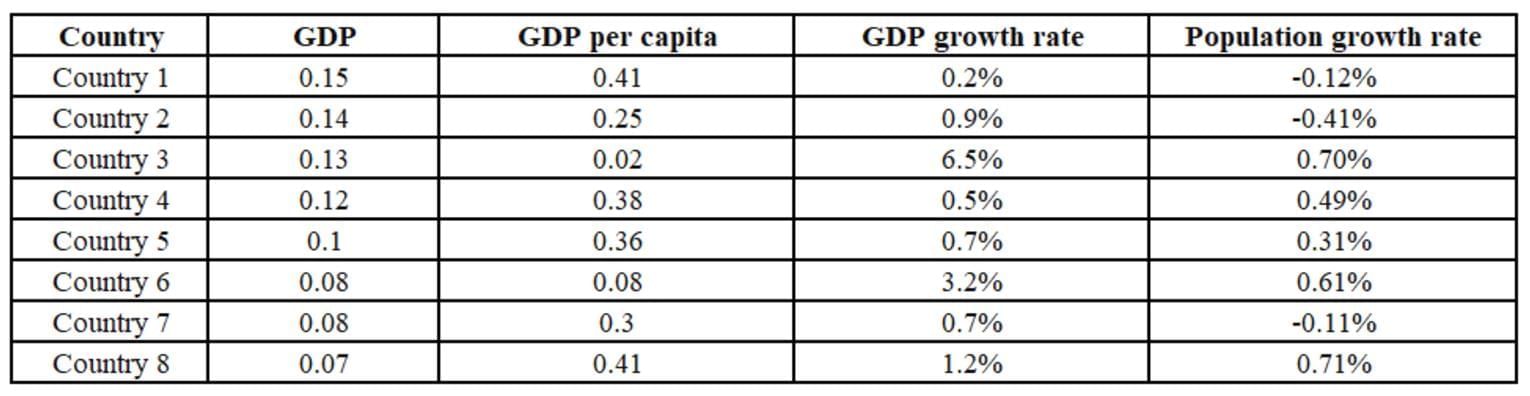
Out of 10 countries -- Country 1 through Country 10 -- Country 9 has the highest gross domestic product (GDP), and Country 10 has the highest GDP per capita. GDP per capita is the GDP of a country divided by its population. The table below provides the following data about Country 1 through Country 8 for the year 2024.
- Column 1 gives the country's identity.
- Column 2 gives the country’s GDP as a fraction of the GDP of Country 9.
- Column 3 gives the country’s GDP per capita as a fraction of the GDP per capita of Country 10.
- Column 4 gives the country’s annual GDP growth rate.
- Column 5 gives the country’s annual population growth rate.
Assume that the GDP growth rates and population growth rates of the countries will remain constant for the next three years.
Q1: Which one among the countries 1 through 8, has the smallest population in 2024?
(a) Country 8
(b) Country 3
(c) Country 7
(d) Country 5
 View Answer
Ans: (a)
We are given the following table,
This table compares the GDP, GDP per capita, and population of eight countries, all of which are referenced using a consistent set of units.
Specifically, the GDP values are all given with the same country as the reference point (The reference point being Country 9)
Similarly, the GDP per capita among the eight countries in the table is given using the same reference point (The reference point being Country 10)
As a result, when comparing two countries from the list in terms of GDP, GDP per capita, or population, we can directly use the values presented in the table, since they are all based on a uniform reference point.
We can compare the population of two countries using the formula, 
For example, to compare the GDP of Country A and Country B, we can simply use the values listed under "GDP" in the table, as both are referenced using the same country throughout. This eliminates the need for additional conversions or adjustments.
In this question we are asked to find which of the countries among the four options has the least population in 2024 (The current year)
Option A: Country 8
GDP=0.07 and GDP Per Capita=0.41
Population=0.07/0.41 or
Option B: Country 3
GDP=0.13 and GDP Per Capita=0.02
Population=0.13/0.02 or 13/2
Option C: Country 7
GDP=0.08 and GDP Per Capita=0.3
Population=0.08/0.3 or 8/30
Option D: Country 5
GDP=0.1 and GDP Per Capita=0.36
Population=0.1/0.36 or 10/36
Comparing the four values, we are looking for the smallest values among the four, 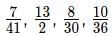
7/41 is the smallest value among the four, hence Option (a) or Country 8 is the answer.
Q2: The ratio of Country 4’s GDP to Country 5’s GDP in 2026 will be closest to
(a) 1.195
(b) 0.963
(c) 1.314
(d) 1.032
View Answer Ans: (a)
We are given the following table,

This table compares the GDP, GDP per capita, and population of eight countries, all of which are referenced using a consistent set of units.
Specifically, the GDP values are all given with the same country as the reference point (The reference point being Country 9)
Similarly, the GDP per capita among the eight countries in the table is given using the same reference point (The reference point being Country 10)
As a result, when comparing two countries from the list in terms of GDP, GDP per capita, or population, we can directly use the values presented in the table, since they are all based on a uniform reference point.
We can compare the population of two countries using the formula, 
For example, to compare the GDP of Country A and Country B, we can simply use the values listed under "GDP" in the table, as both are referenced using the same country throughout. This eliminates the need for additional conversions or adjustments.
We are given the GDP growth rate and we are told it is constant over the next three years,
Country 4 GDP: 0.12 and the given growth rate is 0.5%
GDP of Country 4 in 2026 will be this equals 0.121203
Country 4 GDP: 0.1 and the given growth rate is 3.2
GDP of Country 5 in 2026 will be this equals 0.1014049
Ratio will be, 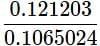 this equals 1.19523
Hence, the answer is Option (a).
Q3: Which one among the countries 1, 4, 5, and 7 will have the largest population in 2027?
(a) Country 1
(b) Country 5
(c) Country 7
(d) Country 4
View Answer Ans: (a)
We are given the following table,

This table compares the GDP, GDP per capita, and population of eight countries, all of which are referenced using a consistent set of units.
Specifically, the GDP values are all given with the same country as the reference point (The reference point being Country 9)
Similarly, the GDP per capita among the eight countries in the table is given using the same reference point (The reference point being Country 10)
As a result, when comparing two countries from the list in terms of GDP, GDP per capita, or population, we can directly use the values presented in the table, since they are all based on a uniform reference point.
We can compare the population of two countries using the formula, 
For example, to compare the GDP of Country A and Country B, we can simply use the values listed under "GDP" in the table, as both are referenced using the same country throughout. This eliminates the need for additional conversions or adjustments.
The given question asks us to compare the population of countries between 1, 4, 5, and 7 in the year 2027
Country 1: Population in 2024 will be 0.15/0.41 or 15/41 and the population is decreasing at the rate 0.12%
Country 4: Population in 2024 will be 0.12/0.38 or 12/38 and the population is increasing at the rate of 0.49%
Country 5: Population in 2024 will be 0.1/0.36 or 10/36 and the population is increasing at the rate 0.31%
Country 7: Population in 2024 will be 0.08/0.3 or 8/30 and the population is decreasing at the rate 0.11%
Simplifying and comparing the four fractions in order, 15/41, 6/19, 5/18, 4/15
The decimal values of the following are: 0.36586, 0.315789, 0.2777, 0.2666
Right away we can eliminate Country 7 since the population is not only the least, but it is decreasing, so there is no chance it will have the highest population in three years time.
For the other three countries,
Country 1: this equals 0.36453
Country 4: this equals 0.32045
Country 7: this equals 0.2803612
Hence, Country 1 will have the largest population among these four countries.
Q4: For how many countries among Country 1 through Country 8 will the GDP per capita in 2027 be lower than that in 2024?
View Answer Ans: 0
We are given the following table,

This table compares the GDP, GDP per capita, and population of eight countries, all of which are referenced using a consistent set of units.
Specifically, the GDP values are all given with the same country as the reference point (The reference point being Country 9)
Similarly, the GDP per capita among the eight countries in the table is given using the same reference point (The reference point being Country 10)
As a result, when comparing two countries from the list in terms of GDP, GDP per capita, or population, we can directly use the values presented in the table, since they are all based on a uniform reference point.
We can compare the population of two countries using the formula, 
For example, to compare the GDP of Country A and Country B, we can simply use the values listed under "GDP" in the table, as both are referenced using the same country throughout. This eliminates the need for additional conversions or adjustments.
We are asked to find the number of countries where the GDP per capita is lower in 2027 than it was in 2024.
For the GDP per capita to be lower in the consequent years, the population growth rate has to exceed the GDP growth rate, since GDP per capita is nothing but GDP divided by the population. That means if the population growth rate is lesser than that of the GDP growth rate, the GDP per capita will only increase.
We can clearly see that none of the following countries fall in the scenario where GDP growth rate is lesser than that of the population growth rate. Countries 1, 2 and 7 have actually decreasing population rates thereby definitely increasing the GDP per capita.
The rest of the countries have GDP growth rates larger than the population growth rates.
Hence, we can conclude that, none of the countries will have a smaller GDP per capita in 2027 when compared to 2024.
|
102 videos|123 docs|121 tests
|
FAQs on Practice Question - 31 (Quant Based DI) - 100 DILR Questions for CAT Preparation
| 1. What is the significance of practicing quantitative data interpretation for competitive exams? |  |
| 2. How can I effectively prepare for the quantitative data interpretation section? | |
| 3. What types of questions are typically included in the quantitative data interpretation section of exams? | |
| 4. Are there specific strategies to solve data interpretation questions quickly? | |
| 5. How important is accuracy when answering quantitative data interpretation questions? | |


mock tests for examination
,Sample Paper
,Extra Questions
,past year papers
,video lectures
,Practice Question - 31 (Quant Based DI) | 100 DILR Questions for CAT Preparation
,Free
,Important questions
,shortcuts and tricks
,Practice Question - 31 (Quant Based DI) | 100 DILR Questions for CAT Preparation
,practice quizzes
,Summary
,Previous Year Questions with Solutions
,Objective type Questions
,Practice Question - 31 (Quant Based DI) | 100 DILR Questions for CAT Preparation
,Semester Notes
,study material
,Exam
,MCQs
,ppt
,Viva Questions
;


Practice Question - 31 (Quant Based DI) Free PDF Download
Importance of Practice Question - 31 (Quant Based DI)
Practice Question - 31 (Quant Based DI) Notes
Practice Question - 31 (Quant Based DI) CAT Questions
Study Practice Question - 31 (Quant Based DI) on the App
|
© EduRev
|
Education Revolution
|


|


