Practice Question - 57 (Special Charts) | 100 DILR Questions for CAT Preparation PDF Download

The two plots below show data for four companies code-named A, B, C, and D over three years - 2019, 2020, and 2021.
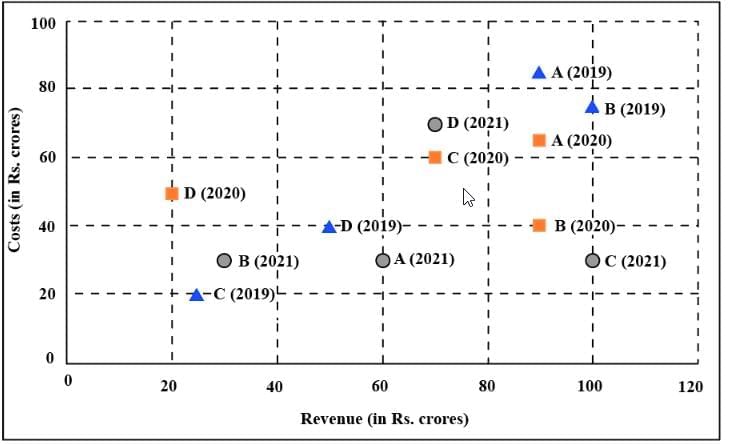
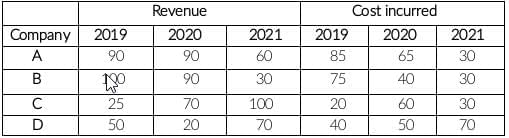
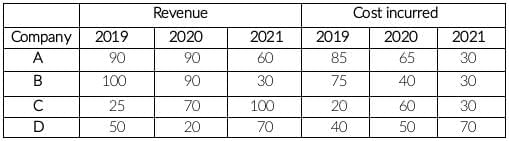
The first plot shows the revenues and costs incurred by the companies during these years. For example, in 2021, company C earned Rs.100 crores in revenue and spent Rs.30 crores. The profit of a company is defined as its revenue minus its costs
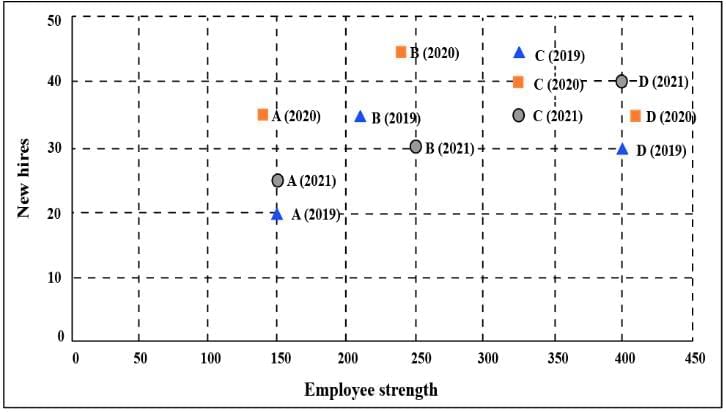
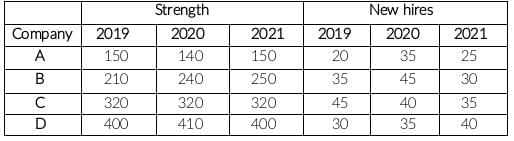
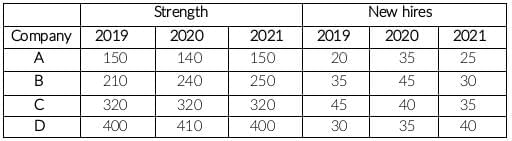
The second plot shows the number of employees employed by the company (employee strength) at the start of each of these three years, as well as the number of new employees hired each year (new hires). For example, Company B had 250 employees at the start of 2021, and 30 new employees joined the company during the year.
Q1: Considering all three years, which company had the highest annual profit?
(a) Company A
(b) Company D
(c) Company B
(d) Company C
 View Answer
Ans: (d)
It is given,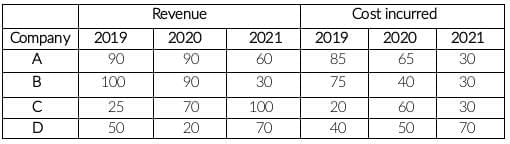 Company A:
Revenue = 240 and cost incurred = 180
Profit = 240 - 180 = 60
Company B:
Revenue = 220 and cost incurred = 145
Profit = 220 - 145 = 75
Company C:
Revenue = 195 and cost incurred = 110
Profit = 195 - 110 = 85
Company D:
Revenue = 140 and cost incurred = 160
No profit.
Company C had the highest annual profit.
The answer is option D.
Q2: Which of the four companies experienced the highest annual loss in any of the years?
(a) Company C
(b) Company A
(c) Company B
(d) Company D
View Answer Ans: (d)
 For all the companies in all three years, cost incurred is less than Revenue except for D in 2020.
Revenue is 20 and cost incurred is 50
Company D experienced the highest annual loss in 2020.
The answer is option D.
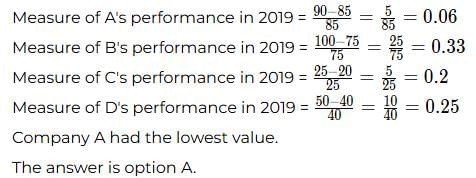
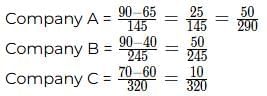
Q3: The ratio of a company's annual profit to its annual costs is a measure of its performance. Which of the four companies had the lowest value of this ratio in 2019?
(a) Company A
(b) Company D
(c) Company B
(d) Company C
View Answer Ans: (a)
It is given,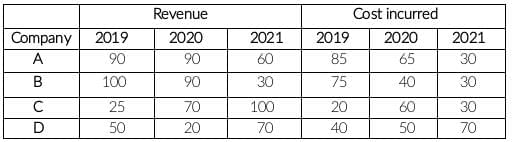
Q4: The total number of employees lost in 2019 and 2020 was the least for:
(a) Company B
(b) Company D
(c) Company A
(d) Company C
View Answer Ans: (b)
It is given,
Company A:
The number of employees in the beginning of 2019 = 150
The number of employees hired in 2019 = 2
The number of employees should be at the beginning of 2020 is 150+20, i.e. 170 but there are 140 only. This implies 30 left company A in 2019.
The number of employees in the beginning of 2020 = 140
The number of employees hired in 2020 = 35
The number of employees should be at the beginning of 2021 is 140+35, i.e. 175 but there are 150 only. This implies 25 left company A in 2020.
The number of employees left company A in 2019 and 2020 = 30 + 25 = 55
Company B:
Similarly, the number of employees left company B in 2019 = 210 + 35 - 240 = 5
The number of employees left company B in 2020 = 240 + 45 - 250 = 35
The number of employees left company B in 2019 and 2020 = 5 + 35 = 40
Company C:
Similarly, the number of employees left company C in 2019 = 320 + 45 - 320 = 45
The number of employees left company C in 2020 = 320 + 40 - 320 = 40
The number of employees left company C in 2019 and 2020 = 45 + 40 = 85
Company D:
Similarly, the number of employees left company D in 2019 = 400 + 30 - 410 = 20
The number of employees left company D in 2020 = 410 + 35 - 400 = 45
The number of employees left company D in 2019 and 2020 = 20 + 45 = 65
The total number of employees lost in 2019 and 2020 is least for company B.
The answer is option A.
Q5: Profit per employee is the ratio of a company's profit to its employee strength. For this purpose, the employee strength in a year is the average of the employee strength at the beginning of that year and the beginning of the next year. In 2020, which of the four companies had the highest profit per employee?
(a) Company D
(b) Company C
(c) Company B
(d) Company A
View Answer Ans: (c)
It is given,
Company B had the highest profit per employee.
The answer is option C.
|
102 videos|123 docs|121 tests
|
FAQs on Practice Question - 57 (Special Charts) - 100 DILR Questions for CAT Preparation
| 1. What are special charts, and why are they important in competitive exams like the CAT? |  |
| 2. How can I effectively read and interpret special charts during the CAT exam? | |
| 3. What types of special charts are commonly encountered in the CAT exam? | |
| 4. What strategies can I use to practice special charts for the CAT exam? | |
| 5. How much weight do special charts and data interpretation carry in the overall CAT exam scoring? | |


Practice Question - 57 (Special Charts) | 100 DILR Questions for CAT Preparation
,practice quizzes
,Extra Questions
,Previous Year Questions with Solutions
,ppt
,Sample Paper
,Semester Notes
,Important questions
,Practice Question - 57 (Special Charts) | 100 DILR Questions for CAT Preparation
,Practice Question - 57 (Special Charts) | 100 DILR Questions for CAT Preparation
,Exam
,study material
,Free
,video lectures
,mock tests for examination
,past year papers
,Summary
,shortcuts and tricks
,Viva Questions
,MCQs
,Objective type Questions
;


Practice Question - 57 (Special Charts) Free PDF Download
Importance of Practice Question - 57 (Special Charts)
Practice Question - 57 (Special Charts) Notes
Practice Question - 57 (Special Charts) CAT Questions
Study Practice Question - 57 (Special Charts) on the App
|
© EduRev
|
Education Revolution
|


|


