Practice Question - 63 (Tables) | 100 DILR Questions for CAT Preparation PDF Download
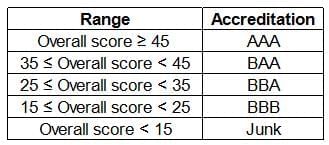
An agency entrusted to accredit colleges looks at four parameters: faculty quality (F), reputation (R), placement quality (P), and infrastructure (I). The four parameters are used to arrive at an overall score, which the agency uses to give an accreditation to the colleges. In each parameter, there are five possible letter grades given, each carrying certain points: A (50 points), B (40 points), C (30 points), D (20 points), and F (0 points). The overall score for a college is the weighted sum of the points scored in the four parameters. The weights of the parameters are 0.1, 0.2, 0.3 and 0.4 in some order, but the order is not disclosed. Accreditation is awarded based on the following scheme:
 Eight colleges apply for accreditation, and receive the following grades in the four parameters (F, R, P, and I):
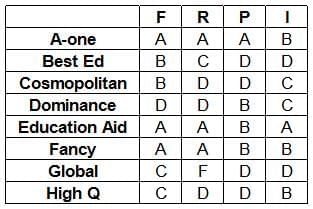
It is further known that in terms of overall scores:
- High Q is better than Best Ed;
- Best Ed is better than Cosmopolitan; and
- Education Aid is better than A-one.
Q1: What is the weight of the faculty quality parameter?
(a) 0.2
(b) 0.3
(c) 0.4
(d) 0.1
 View Answer
Ans: (d)
It is given that: High Q > Best Ed > Cosmopolitan and Education Aid > A-one
We can say that High Q > Cosmopolitan
We can see that both High Q and Cosmopolitan got same points in reputation (R) and placement quality (P). High Q received more points in infrastructure (I) than Cosmopolitan whereas Cosmopolitan received more points in faculty Quality (F) than High Q.
Hence, we can say that Infrastructure's weight should be greater than Faculty quality. i.e. I > F
Similarly, We can see that both Best Ed and Cosmopolitan got same points in faculty Quality (F) and placement quality (P). Best Ed received more points in reputation (R) than Cosmopolitan whereas Cosmopolitan received more points in infrastructure (I) than Best Ed.
Hence, we can say that reputation's weight should be greater than infrastructure. i.e. R > I
Similarly, We can see that both Education Aid and A-one got same points in faculty Quality (F) and reputation (R). Education Aid received more points in infrastructure (I) than A-one whereas A-one received more points in placement quality (P) than Education Aid.
Hence, we can say that reputation's weight should be greater than infrastructure. i.e. I > P
So basically there are two possible cases: R > I > P > F or R > I > F > P
Case 1: Order of weights assigned = R > I > P > F
R = 0.4, I = 0.3. P = 0.2, F = 0.1
In this case overall score received by Best Ed = 0.1*40+0.4*30+0.2*20+0.3*20 = 26
In this case overall score received by High Q = 0.1*30+0.4*20+0.2*20+0.3*40 = 27
We can see that High Q's overall score is higher than Best Ed. Hence, this is a possible case.
Case 2: Order of weights assigned = R > I > F > P
R = 0.4, I = 0.3. P = 0.1, F = 0.2
In this case overall score received by Best Ed = 0.2*40+0.4*30+0.1*20+0.3*20 = 28
In this case overall score received by High Q = 0.2*30+0.4*20+0.1*20+0.3*40 = 28
We can see that High Q's overall score is not greater than the overall score received Best Ed. Hence, this case is not possible.
Now that we know the weight of each parameter, we can calculate the overall score and accreditation received by each college.
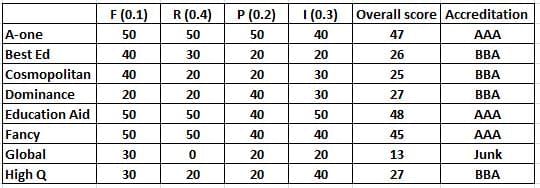
We can see that weight of the faculty quality parameter = 0.1. Hence, option (d) is the correct answer.
Q2: How many colleges receive the accreditation of AAA?
 View Answer
Ans: 3
It is given that: High Q > Best Ed > Cosmopolitan and Education Aid > A-one
We can say that High Q > Cosmopolitan
We can see that both High Q and Cosmopolitan got same points in reputation (R) and placement quality (P). High Q received more points in infrastructure (I) than Cosmopolitan whereas Cosmopolitan received more points in faculty Quality (F) than High Q.
Hence, we can say that Infrastructure's weight should be greater than Faculty quality. i.e. I > F
Similarly, We can see that both Best Ed and Cosmopolitan got same points in faculty Quality (F) and placement quality (P). Best Ed received more points in reputation (R) than Cosmopolitan whereas Cosmopolitan received more points in infrastructure (I) than Best Ed.
Hence, we can say that reputation's weight should be greater than infrastructure. i.e. R > I
Similarly, We can see that both Education Aid and A-one got same points in faculty Quality (F) and reputation (R). Education Aid received more points in infrastructure (I) than A-one whereas A-one received more points in placement quality (P) than Education Aid.
Hence, we can say that reputation's weight should be greater than infrastructure. i.e. I > P
So basically there are two possible cases: R > I > P > F or R > I > F > P
Case 1: Order of weights assigned = R > I > P > F
R = 0.4, I = 0.3. P = 0.2, F = 0.1
In this case overall score received by Best Ed = 0.1*40+0.4*30+0.2*20+0.3*20 = 26
In this case overall score received by High Q = 0.1*30+0.4*20+0.2*20+0.3*40 = 27
We can see that High Q's overall score is higher than Best Ed. Hence, this is a possible case.
Case 2: Order of weights assigned = R > I > F > P
R = 0.4, I = 0.3. P = 0.1, F = 0.2
In this case overall score received by Best Ed = 0.2*40+0.4*30+0.1*20+0.3*20 = 28
In this case overall score received by High Q = 0.2*30+0.4*20+0.1*20+0.3*40 = 28
We can see that High Q's overall score is not greater than the overall score received Best Ed. Hence, this case is not possible.
Now that we know the weight of each parameter, we can calculate the overall score and accreditation received by each college.
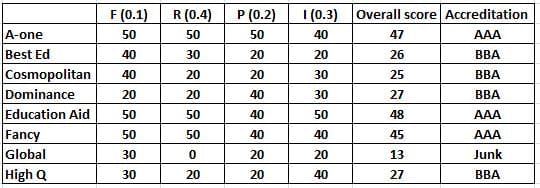
From the table, we can see that three received the accreditation of AAA.
Q3: What is the highest overall score among the eight colleges ?
 View Answer
Ans: 48
It is given that: High Q > Best Ed > Cosmopolitan and Education Aid > A-one
We can say that High Q > Cosmopolitan
We can see that both High Q and Cosmopolitan got same points in reputation (R) and placement quality (P). High Q received more points in infrastructure (I) than Cosmopolitan whereas Cosmopolitan received more points in faculty Quality (F) than High Q.
Hence, we can say that Infrastructure's weight should be greater than Faculty quality. i.e. I > F
Similarly, We can see that both Best Ed and Cosmopolitan got same points in faculty Quality (F) and placement quality (P). Best Ed received more points in reputation (R) than Cosmopolitan whereas Cosmopolitan received more points in infrastructure (I) than Best Ed.
Hence, we can say that reputation's weight should be greater than infrastructure. i.e. R > I
Similarly, We can see that both Education Aid and A-one got same points in faculty Quality (F) and reputation (R). Education Aid received more points in infrastructure (I) than A-one whereas A-one received more points in placement quality (P) than Education Aid.
Hence, we can say that reputation's weight should be greater than infrastructure. i.e. I > P
So basically there are two possible cases: R > I > P > F or R > I > F > P
Case 1: Order of weights assigned = R > I > P > F
R = 0.4, I = 0.3. P = 0.2, F = 0.1
In this case overall score received by Best Ed = 0.1*40+0.4*30+0.2*20+0.3*20 = 26
In this case overall score received by High Q = 0.1*30+0.4*20+0.2*20+0.3*40 = 27
We can see that High Q's overall score is higher than Best Ed. Hence, this is a possible case.
Case 2: Order of weights assigned = R > I > F > P
R = 0.4, I = 0.3. P = 0.1, F = 0.2
In this case overall score received by Best Ed = 0.2*40+0.4*30+0.1*20+0.3*20 = 28
In this case overall score received by High Q = 0.2*30+0.4*20+0.1*20+0.3*40 = 28
We can see that High Q's overall score is not greater than the overall score received Best Ed. Hence, this case is not possible.
Now that we know the weight of each parameter, we can calculate the overall score and accreditation received by each college.
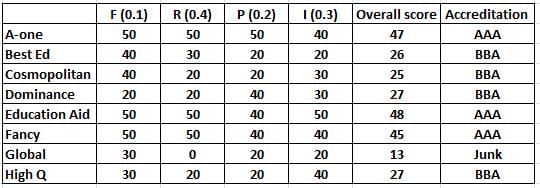
From the table we can see that Education Aid scored the highest overall score = 48.
Q4: How many colleges have overall scores between 31 and 40, both inclusive?
(a) 0
(b) 2
(c) 1
(d) 3
 View Answer
Ans: (a)
It is given that: High Q > Best Ed > Cosmopolitan and Education Aid > A-one
We can say that High Q > Cosmopolitan
We can see that both High Q and Cosmopolitan got same points in reputation (R) and placement quality (P). High Q received more points in infrastructure (I) than Cosmopolitan whereas Cosmopolitan received more points in faculty Quality (F) than High Q.
Hence, we can say that Infrastructure's weight should be greater than Faculty quality. i.e. I > F
Similarly, We can see that both Best Ed and Cosmopolitan got same points in faculty Quality (F) and placement quality (P). Best Ed received more points in reputation (R) than Cosmopolitan whereas Cosmopolitan received more points in infrastructure (I) than Best Ed.
Hence, we can say that reputation's weight should be greater than infrastructure. i.e. R > I
Similarly, We can see that both Education Aid and A-one got same points in faculty Quality (F) and reputation (R). Education Aid received more points in infrastructure (I) than A-one whereas A-one received more points in placement quality (P) than Education Aid.
Hence, we can say that reputation's weight should be greater than infrastructure. i.e. I > P
So basically there are two possible cases: R > I > P > F or R > I > F > P
Case 1: Order of weights assigned = R > I > P > F
R = 0.4, I = 0.3. P = 0.2, F = 0.1
In this case overall score received by Best Ed = 0.1*40+0.4*30+0.2*20+0.3*20 = 26
In this case overall score received by High Q = 0.1*30+0.4*20+0.2*20+0.3*40 = 27
We can see that High Q's overall score is higher than Best Ed. Hence, this is a possible case.
Case 2: Order of weights assigned = R > I > F > P
R = 0.4, I = 0.3. P = 0.1, F = 0.2
In this case overall score received by Best Ed = 0.2*40+0.4*30+0.1*20+0.3*20 = 28
In this case overall score received by High Q = 0.2*30+0.4*20+0.1*20+0.3*40 = 28
We can see that High Q's overall score is not greater than the overall score received Best Ed. Hence, this case is not possible.
Now that we know the weight of each parameter, we can calculate the overall score and accreditation received by each college.
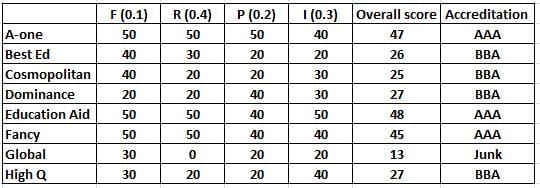
From the table we can see that none of the mentioned college received an overall scores between 31 and 40, both inclusive. Hence, option (a) is the correct answer.
|
102 videos|123 docs|121 tests
|
FAQs on Practice Question - 63 (Tables) - 100 DILR Questions for CAT Preparation
| 1. What is the significance of tables in data representation? |  |
| 2. How can I effectively analyze data presented in tables? |  |
| 3. What are common mistakes to avoid when interpreting tables? |  |
| 4. What types of data are best suited for tabular representation? |  |
| 5. How can I create an effective table for presenting my data? |  |


