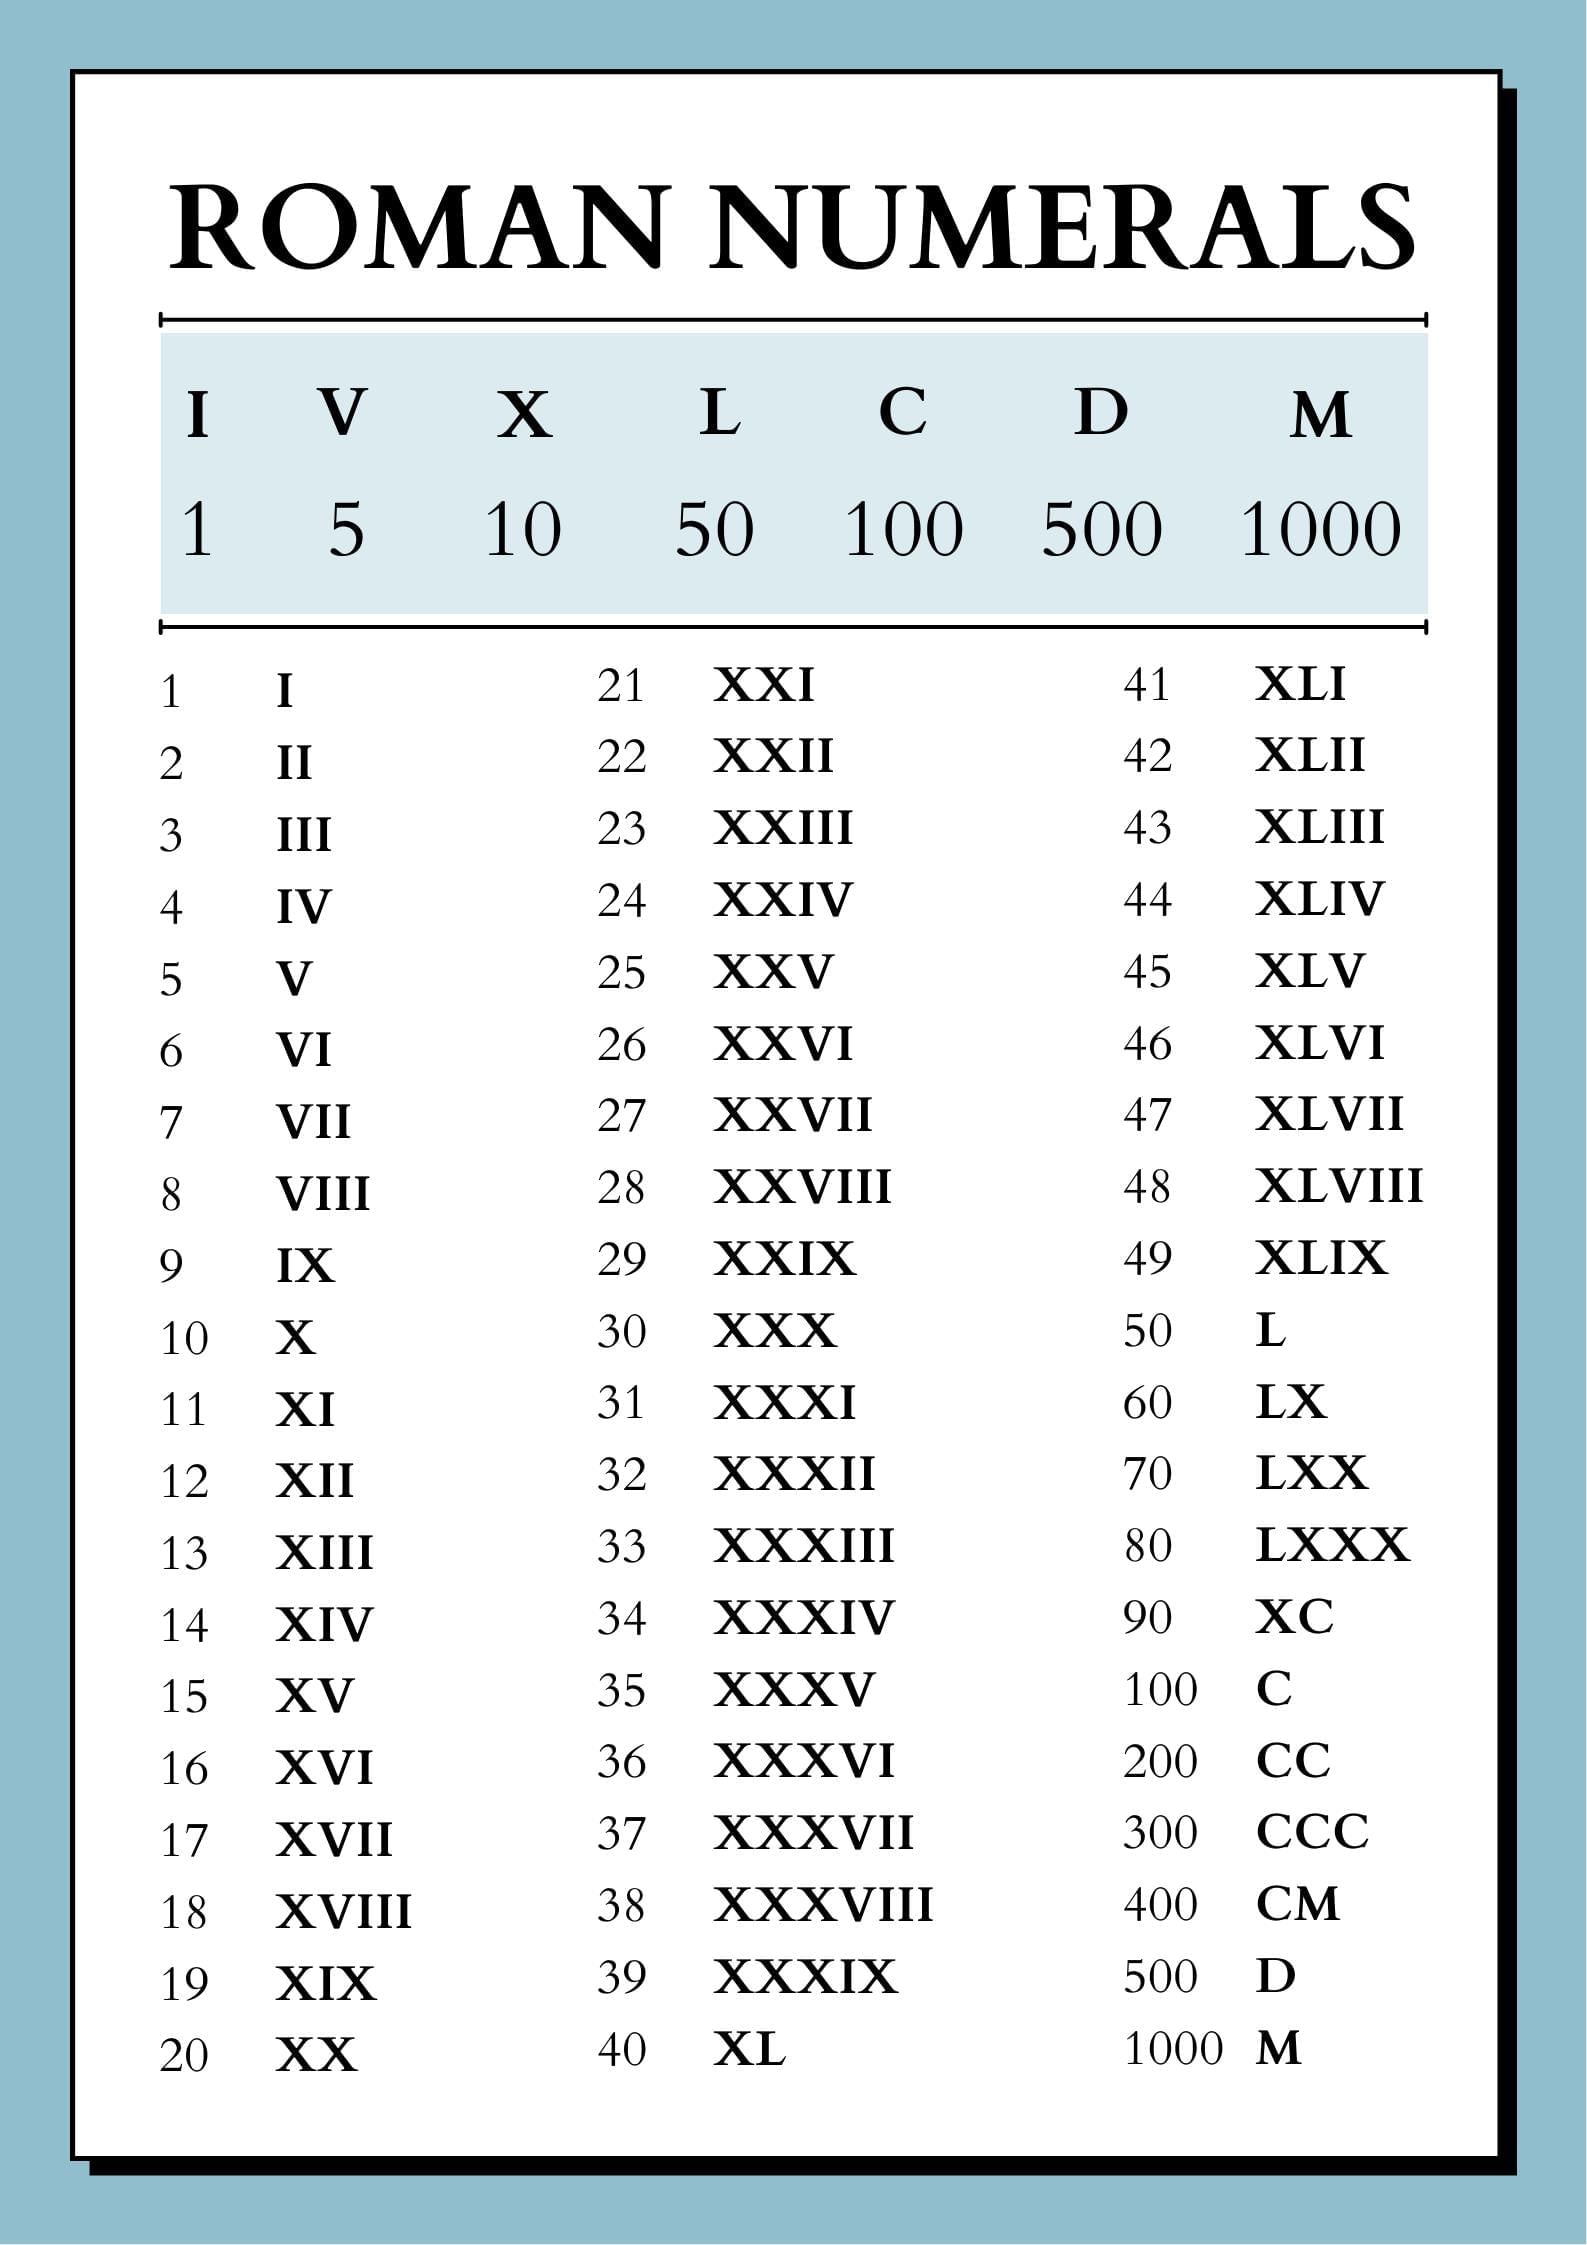
Class 8 Exam > Class 8 Notes > Mathematics Class 8- New NCERT (Ganita Prakash) > Infographics: A Story of Numbers
Infographics: A Story of Numbers | Mathematics Class 8- New NCERT (Ganita Prakash) PDF Download

The document Infographics: A Story of Numbers | Mathematics Class 8- New NCERT (Ganita Prakash) is a part of the Class 8 Course Mathematics Class 8- New NCERT (Ganita Prakash).
All you need of Class 8 at this link: Class 8
|
26 videos|133 docs|11 tests
|
FAQs on Infographics: A Story of Numbers - Mathematics Class 8- New NCERT (Ganita Prakash)
| 1. What are infographics and how are they used to present information? |  |
Ans. Infographics are visual representations of information, data, or knowledge that aim to present complex information quickly and clearly. They often combine images, charts, and text to convey messages effectively. Infographics are widely used in various fields such as education, marketing, and journalism to help audiences understand trends, statistics, or processes at a glance.
| 2. Why are numbers important in infographics? |  |
Ans. Numbers are critical in infographics because they provide quantifiable data that can support arguments, illustrate trends, and highlight key points. By using numbers, infographics can offer concrete evidence that enhances the credibility of the information presented and makes it easier for viewers to grasp the significance of the data.
| 3. What elements should be included in an effective infographic? |  |
Ans. An effective infographic should include a clear title, relevant data or statistics, visual elements like charts or graphs, and concise text that explains the information. Additionally, it should have a logical flow and design that guides the viewer through the content, making it visually appealing and easy to understand.
| 4. How do colors and design impact the effectiveness of an infographic? |  |
Ans. Colors and design play a significant role in the effectiveness of an infographic by influencing the viewer's attention and comprehension. Thoughtful use of color can highlight important information, create visual hierarchy, and evoke emotions. A well-designed layout ensures that the information is organized and accessible, facilitating better understanding and retention.
| 5. Can infographics be used in educational settings? If so, how? |  |
Ans. Yes, infographics can be used in educational settings to enhance learning. They can simplify complex topics, making information more engaging for students. Teachers can use infographics to present data, summarize lessons, or encourage students to create their own infographics as a way to research and present information creatively, thus reinforcing their understanding of the subject matter.
Related Searches


