Case Based Questions: Data Handling and Presentation

Case Study 1
Ankita manages a book stall at a fair. She recorded the genres of books sold on Monday and presented the data in the following table 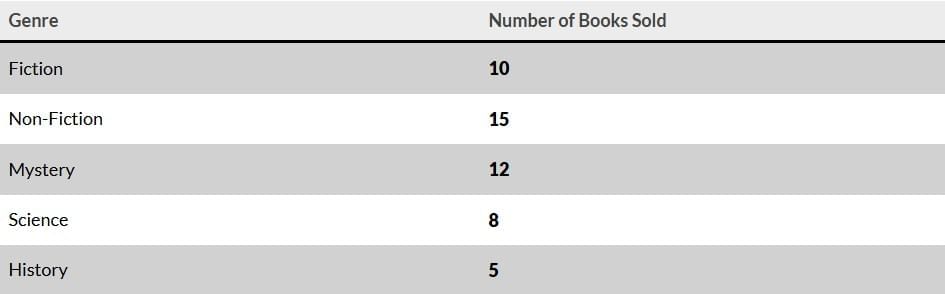 Q.1.What is the total number of books sold on Monday?
(a) 45
(b) 50
(c) 55
(d) 60
Q.2. Which genre of books sold the least on Monday?
(a) Fiction
(b) Non-Fiction
(c) History
(d) Science
Q.3. If Ankita sells 5 more mystery books on Tuesday, what will be the total number of mystery books sold?
(a) 12
(b) 15
(c) 17
(d) 20
Q.4. The price of one fiction book is ₹150. How much money did Ankita earn by selling all fiction books on Monday?
(a) ₹1,000
(b) ₹1,200
(c) ₹1,500
(d) ₹1,800
Q.5. If Ankita wants to present this data in a bar graph, how many bars will the graph contain?
(a) 3
(b) 4
(c) 5
(d) 6
Case Study 2
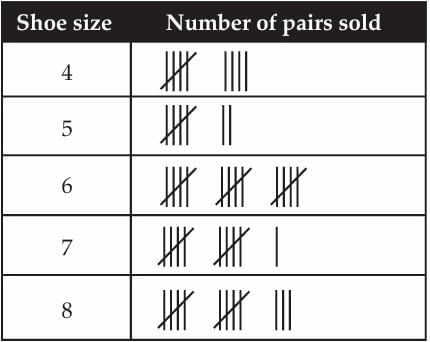
Shobhit works in a shoe store. He records the shoe sizes and the number of pairs sold every day. On Tuesday, he sold 60 pairs. His record for the day is shown below.
Q.1. How many pairs of size 8 were sold on Tuesday?
(a) 3
(b) 10
(c) 11
(d) 13
Q.2. Which shoe size sold the most?
(a) Size 4
(b) Size 6
(c) Size 8
(d) Size 9
Q.3. Shobit realised that he had not fully recorded the sale for Tuesday. How many sold pairs had he not recorded?
Q.4. The unrecorded data was of shoe size 7. Shobit corrected his record accordingly. Which of the following statements will be true now?
(a) Shoe size 8 sold the least now
(b) Shoe size 7 sold the most now
(c) Shoe size 5 is the new mode of the data
(d) Number of shoe pairs of size 3 can be calculated
Q.5. The price of one shoe pair of size 5 is 800. How much money had Shobhit collected by selling all the shoe pairs of size 5?
Case Study 3
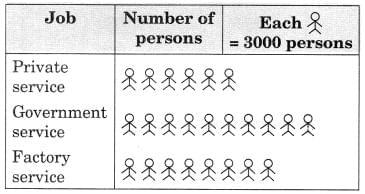
Read the pictograph given below and answer the following questions:Persons employed in one year
 Q.1.What is the number of persons employed in government service?
(b) How many more person were employed in government service than in private service?
(c) In which service, were the maximum number of persons employed?
Case Study 4
The given bar graph represents the frequency of a, e, i, o, and u in a piece of English writing.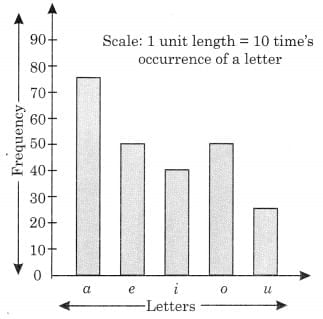 Q.1. Which letter occurred the maximum number of times?
Q.2. Which letter occurred 40 times?
Q.3. Which letter occurred less than 30 times?
Q.4. Write down the five letters in the decreasing order of frequencies.
FAQs on Case Based Questions: Data Handling and Presentation
| 1. What is data handling in the context of Class 6 studies? |  |
| 2. Why is data presentation important for students? | |
| 3. What types of data representation are commonly taught in Class 6? | |
| 4. How can students ensure accuracy when collecting data for their projects? | |
| 5. What skills do students develop through data handling and presentation activities? | |


