Unit Test (Solutions): Data Handling and Presentation | Mathematics for Class 6 PDF Download

Time: 1 hour
Maximum Marks: 30
Attempt all questions.
Question numbers 1 to 5 carry 1 mark each.
Question numbers 6 & 7 carry 3 marks each.
Question number 8 carry 4 marks.
Question numbers 9 to 11 carry 5 marks each.
Q1: Navya collected data on her classmates' favourite fruits. She found that 8 students liked apples, 12 liked bananas, and 5 liked oranges. The total number of students she surveyed is _______. (1 Mark)
Ans: 25
The total number is found by adding the number of students who liked each fruit: 8 + 12 + 5 = 25.
Q2: A pictograph uses 1 symbol to represent 5 students. If 4 symbols are used to show the number of students who like chocolate, then _______ students like chocolate. (1 Mark)
Ans: 20
Multiply the number of symbols (4) by the number each symbol represents (5): 4 × 5 = 20.
Q3: In a bar graph, the bar representing the number of students absent in Class 5 is twice the height of the bar for Class 3. If Class 3 had 4 students absent, then Class 5 had _______ students absent. (1 Mark)
Ans: 8
Since the bar for Class 5 is twice as high, multiply the number of absent students in Class 3 by 2: 4 × 2 = 8.
Q4: If each tally mark represents 1 vote and 15 tally marks are recorded for a favorite game survey, then the total number of votes is _______. (1 Mark)
Ans: 15
Each tally mark equals one vote, so the total number of votes equals the number of tally marks.
Q5: The number of symbols in a pictograph must be multiplied by _______ to find the total if each symbol represents more than one unit. (1 Mark)
Ans: the scale
Multiply the number of symbols by the scale to find the total number of units represented.
Q6: A die was thrown 35 times and the following numbers were obtained: (3 Mark)
5, 1, 4, 2, 3, 2, 6, 6, 1, 4, 2, 5, 4, 5, 3, 6, 1, 5
2, 6, 2, 5, 4, 1, 3, 2, 1, 4, 1, 6, 2, 6, 3, 3, 3
Prepare a frequency table for the data.
Ans: From the given data, we have the following table.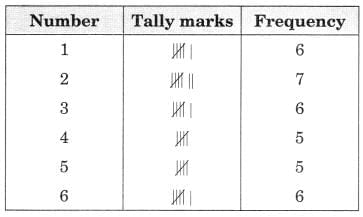
Q7: Samantha visited a tea garden and collected data on the insects and critters she saw there. Here is the data she collected: (3 Mark)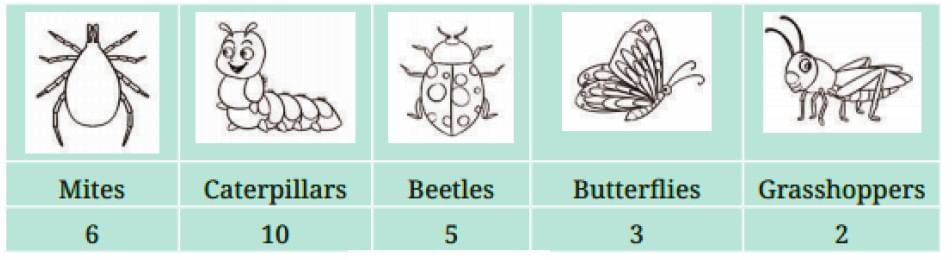
Help her prepare a bar graph representing this data.
Ans: 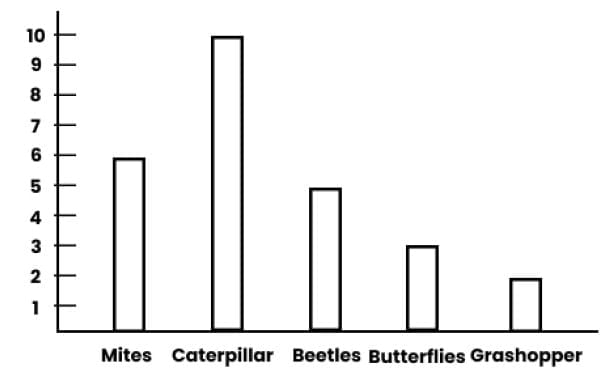
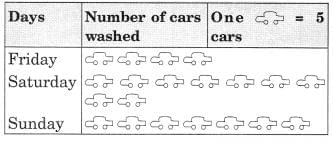 From the pictograph, find that:
(a) How many cars were washed on
(i) Friday
(ii) Saturday
(iii) Sunday?
(b) On which day the maximum number of cars were washed at the station?
(c) On which day the minimum number of cars were washed at the station?
Ans:
(a) (i) On Friday – 4 x 5 = 20 cars (ii) On Saturday – 9 x 5 = 45 cars (iii) On Sunday – 7 x 5 = 35 cars.
(b) On Saturday, the maximum number of cars, i.e., 9 x 5 = 45 were washed at the stations.
(c) On Friday, the minimum number of cars, i.e., 4 x 5 = 20 were washed on the station.
(d) 45 – 20 = 25 more cars were washed on Saturday than on Friday.
Q9: The pictograph shows how many snowballs each child made. Use the pictograph to answer the given questions. (5 Mark)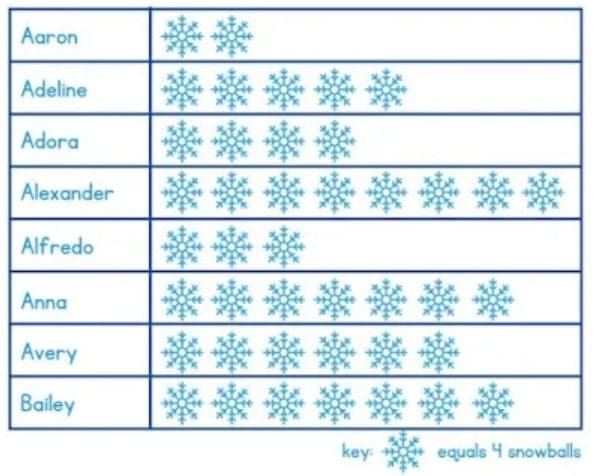
(i) How many snowballs did Alfredo make?
Ans: There are 3 pictures in front of Alfredo. 1 snowflake represents 4 snowballs made.
So, Alfredo made 3×4 = 12 snowballs.
(ii) How many snowballs did Aaron make?
Ans: There are 2 pictures in front of Aaron. 1 snowflake represents 4 snowballs made.
So, Aaron made 2 × 4 = 8 snowballs.
(iii) Name two people who made the same number of snowballs.
Ans: Anna and Bailey made the same number of snowballs.
We can simply look at the number of snowflakes in front of each name and see that Anna and Bailey have same number of snowflakes drawn in front of their names.
There are 7 snowflakes which means 7 × 4 = 28.
So, Anna and Bailey, both of them, made 28 snowballs each.
(iv) How many more snowballs did Bailey make than Adeline?
Ans: Bailey made 28 snowballs where as Adeline made 20 snowballs (5 × 4 = 20)
28 - 20 = 8
Bailey made 8 more snowballs than Adeline.
(v) How many more snowballs did Alexander make than Adora?
Ans: Alexander : 8×4 = 32 snowballs
Adora: 4 × 4 = 16
32 - 16 = 16
Alexander made 16 more snowballs than Adora.
Q10: The following pictograph shows the number of pears in 6 bags (5 Mark)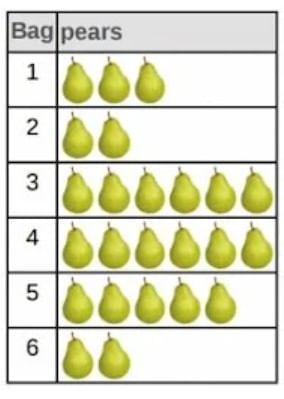
Find the following.
(a) Bag with the maximum number of pears.
(b) Bag with the minimum number of pears.
(c) Total number of pears in all the bags.
Ans: (a) 3 and 4
(b) 2 and 6
(c) 24
Step 1 (a) It is clear from the given pictograph that there are 6 pears in the bags 3 and 4. This is the maximum number of pears in all the bags. Therefore, we can say that the bags 3,4 have the maximum number of pears.
Step 2 (b) It is clear from the given pictograph that there are 2 pears in the bags 2 and 6. This is the minimum number of pears in all the bags. Therefore, we can say that the bags 2,6 have the minimum number of pears.
Step 3 (c) Total number of pears in all the bags = Sum of the pears in all the 6 bags = 3 + 2 + 6 + 6 + 5 + 2 = 24 pears
Q11: Reena collected the data for the ages (in years) of her hobby class group and she recorded the findings in the manner shown below : (5 Mark)
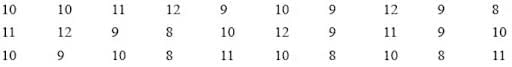
Represent the above data using tally marks in the table below :
Ages (in years) | Tally Marks | Frequency |
8 | | 05 |
9 |
|
|
10 |
|
|
11 |
|
|
12 |
|
|
(i) Find the age that appeared maximum number of times?
(ii) Find the ages that appeared equal number of times.
(iii) How many children are below 11 years?
(iv) How many children are of 10 years or above?
Answer
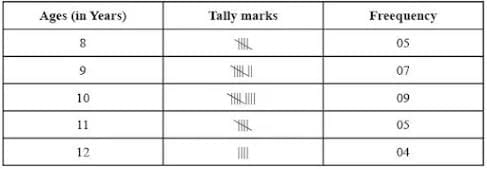
(i) The age that appeared maximum number of times is 10 years.
(ii) 8 years & 11 years of age appeared equal number of times i.e. 5 times.
(iii) The total number of children below 11 years are 5 + 7 + 9 = 21
(iv) The total number of children that are of 10 years and above are 9 + 5 + 4 = 18
|
48 videos|380 docs|23 tests
|
FAQs on Unit Test (Solutions): Data Handling and Presentation - Mathematics for Class 6
| 1. What is data handling in the context of Class 6 studies? |  |
| 2. Why is it important to represent data visually? | |
| 3. What are the different types of data representation students learn in Class 6? | |
| 4. How can students collect data for their projects or assignments? | |
| 5. What skills do students develop by learning data handling and presentation? | |


Objective type Questions
,practice quizzes
,Viva Questions
,Extra Questions
,Unit Test (Solutions): Data Handling and Presentation | Mathematics for Class 6
,MCQs
,mock tests for examination
,video lectures
,study material
,Free
,Unit Test (Solutions): Data Handling and Presentation | Mathematics for Class 6
,Sample Paper
,ppt
,shortcuts and tricks
,Important questions
,Semester Notes
,Summary
,past year papers
,Unit Test (Solutions): Data Handling and Presentation | Mathematics for Class 6
,Exam
,Previous Year Questions with Solutions
;


Unit Test (Solutions): Data Handling and Presentation Free PDF Download
Importance of Unit Test (Solutions): Data Handling and Presentation
Unit Test (Solutions): Data Handling and Presentation Notes
Unit Test (Solutions): Data Handling and Presentation Class 6 Questions
Study Unit Test (Solutions): Data Handling and Presentation on the App
|
© EduRev
|
Education Revolution
|


|


