NCERT Solutions for Class 6 Maths - Data Handling

Exercise 9.1
Q1. In a Mathematics test, the following marks were obtained by 40 students. Arrange these marks in a table using tally marks.
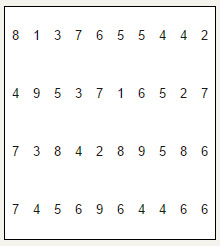
(a) Find how many students obtained marks equal to or more than 7.
(b) How many students obtained marks below 4?
Ans: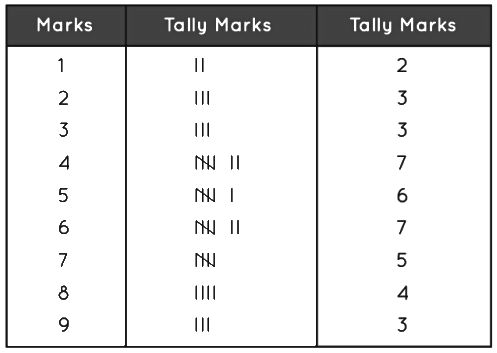
(a) The students who got marks equal to or more than 7 are the students who got marks 7, 8 or 9. Therefore the number of these students are:
= 5 + 4 + 3
= 12
(b) The students who got marks below 4 are the students who got marks 1,2 or 3. Therefore the number of these students are:
= 2 + 3 + 3
= 8
Q2. Following is the choice of sweets of 30 students of Class VI.
Ladoo, Barfi, Ladoo, Jalebi, Ladoo, Rasgulla, Jalebi, Ladoo, Barfi, Rasgulla, Ladoo, Jalebi, Jalebi, Rasgulla, Ladoo, Rasgulla, Jalebi, Ladoo, Rasgulla, Laddo, Ladoo, Barfi, Rasgulla, Rasgulla, Jalebi, Rasgulla, Ladoo, Rasgulla, Jalebi, Ladoo.
(a) Arrange the names of sweets in a table using tally marks.
(b) Which sweet is preferred by most of the students?
Ans:
(a) Table using tally marks: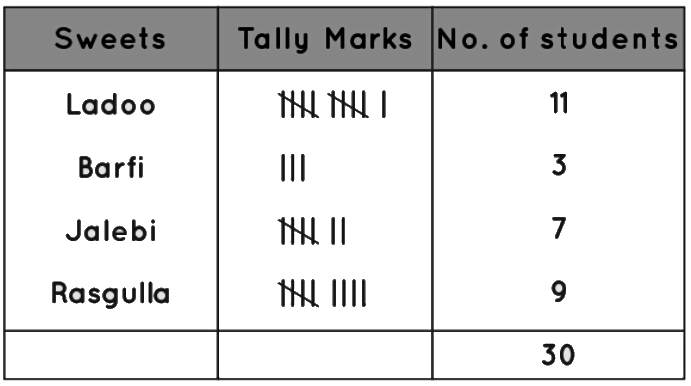
(b) The sweet which is preferred by most of the students is Ladoo. As out of 30, 11 students prefer eating ladoo.
Q3. Catherine threw a dice 40 times and noted the number appearing each time as shown below:
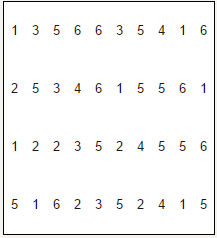
Make a table and enter the data using tally marks. Find the number that appeared.
(a) The minimum number of times
(b) The maximum number of times
(c) Find those numbers that appear an equal number of times.
Ans: 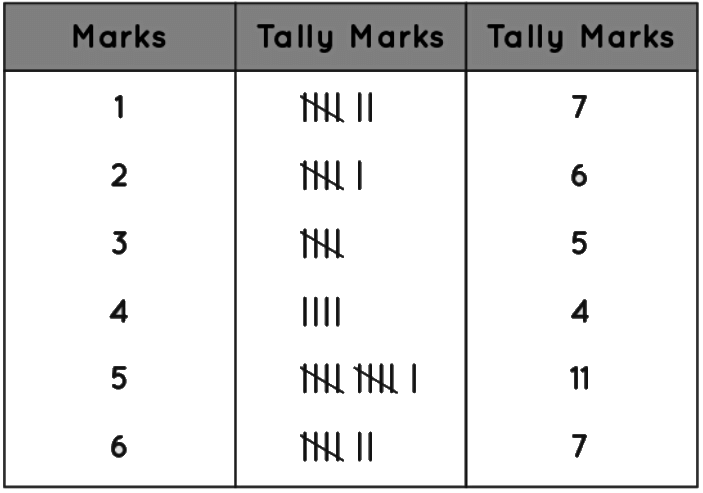
(a) The number that occurred for minimum number of times is 4
(b) The number that occurred for maximum number of times is 5
(c) 1 and 6 are the numbers that appear an equal number of times.
Q4. Following pictograph shows the number of tractors in five villages.
Village | Number of tractors |
Village A |
|
Village B |
|
Village C |
|
Village D |
|
Village E |
|
 = 1 Tractor
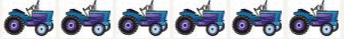


Observe the pictograph and answer the following questions:
(i) Which village has the minimum number of tractors?
(ii) Which village has the maximum number of tractors?
(iii) How many more tractors village C has as compared to village B.
(iv) What is the total number of tractors in all the five villages?
Ans:
(i) Village D has the minimum number of tractors.
(ii) Village C has the maximum number of tractors.
(iii) Village B has 5 tractors
Village C has 8 tractors
= 8 - 5
= 3 Tractors
Village C has 3 more tractors as compared to village B.
(iv) Total number of tractors in all the villages = 6 + 5 + 8 + 3 + 6 = 28 tractors
Q5. The number of girl students in each class of a co-educational middle school is depicted by the pictograph:
Class | Number of girl students |
| I |  |
II |
|
III |
|
IV |
|
 - 4 girls


Observe this pictograph and answer the following questions:
(a) Which class has the minimum number of girl students?
(b) Is the number of girls in Class VI less than the number of girls in Class V?
(c) How many girls are there in Class VII?
Ans: (a) Class VIII has only 6 girls. Therefore, the minimum number of girl students are in Class VIII.
(b) No. Class V has 10 girl students and Class VI has 16 girl students. Therefore, the number of girls in Class VI are more than the number of girls in Class V.
(c) The number of girls in Class VII are 12.
Q6. The sale of electric bulbs on different days of a week is shown below:
Day | Number of electric bulbs |
Monday |
|
Tuesday |
|
Wednesday |
|
Thursday |
|
Friday |
|
Saturday |
|
Sunday |
|
 - 2 bulbs


Observe the pictograph and answer the following questions:
(a) How many bulbs were sold on Friday?
(b) On which day were the maximum number of bulbs sold?
(c) On which of the days same number of bulbs were sold?
(d) On which of the days minimum number of bulbs were sold?
(e) If one big carton can hold 9 bulbs. How many cartons were needed in the given week?
Ans:
(a) Number of bulbs sold on Friday are 14.
(b) Maximum number of bulbs (18) were sold on Sunday.
(c) On Wednesday and Saturday 8 bulbs are sold. Hence equal number of bulbs were sold on Wednesday and Saturday.
(d) The minimum number of bulbs (8) were sold on Wednesday and Saturday.
(e) The total number of bulbs sold in the given week were 86. So the number of carton required to hold 86 bulb = 86/9 ≈10. Hence, 10 cartons required to hold the bulbs.
Q7. In a village, six fruit merchants sold the following number of fruit baskets in a particular season:
Name of fruit merchant | Number of fruit baskets |
Rahim |
|
Lakhanpal |
|
Anwar |
|
Martin |
|
Ranjit Singh |
|
Joseph |
|
 = 100 fruit basket s


Observe this pictograph and answer the following question:
(a) Which merchant sold the maximum number of baskets?
(b) How many fruit baskets were sold by Anwar?
(c) The merchants who have sold 600 or more number of baskets are planning to buy a godown for the next season. Can you name them?
Ans:
(a) Martin sold the maximum number of fruit baskets i.e. 950.
(b) Anwar sold 700 fruit basket
(c) Anwar, Martin, Ranjit Singh are the merchants who sold more than 600 fruit baskets. Hence, these are the merchants who are planning to buy a godown for the next season.
|
30 videos|120 docs|59 tests
|
FAQs on NCERT Solutions for Class 6 Maths - Data Handling
| 1. What is data handling in mathematics? |  |
| 2. What are the different types of data representation methods? | |
| 3. How do you calculate the mean of a data set? | |
| 4. What is the importance of using graphs in data handling? | |
| 5. How can one interpret data from a pie chart? | |


Extra Questions
,Sample Paper
,past year papers
,Previous Year Questions with Solutions
,shortcuts and tricks
,Summary
,Important questions
,Semester Notes
,NCERT Solutions for Class 6 Maths - Data Handling
,mock tests for examination
,NCERT Solutions for Class 6 Maths - Data Handling
,practice quizzes
,Objective type Questions
,video lectures
,Viva Questions
,study material
,NCERT Solutions for Class 6 Maths - Data Handling
,Exam
,MCQs
,Free
,ppt
;


NCERT Solutions: Data Handling Free PDF Download
Importance of NCERT Solutions: Data Handling
NCERT Solutions: Data Handling Notes
NCERT Solutions: Data Handling Class 6 Questions
Study NCERT Solutions: Data Handling on the App
|
© EduRev
|
Education Revolution
|


|


