Analysis of Financial Statements- 1 NCERT Solutions | Accountancy Class 12 - Commerce PDF Download

Short Answer Questions
Q1. List the techniques of Financial Statement Analysis.
Ans:
The following are the commonly used techniques of Financial Statement analysis:
1. Comparative Financial Statements
2. Common Size Financial Statements
3. Trend Analysis
4. Ratio Analysis
5. Cash Flow Statement
6. Fund Flow Statement
The techniques can be classified based on the following criteria:
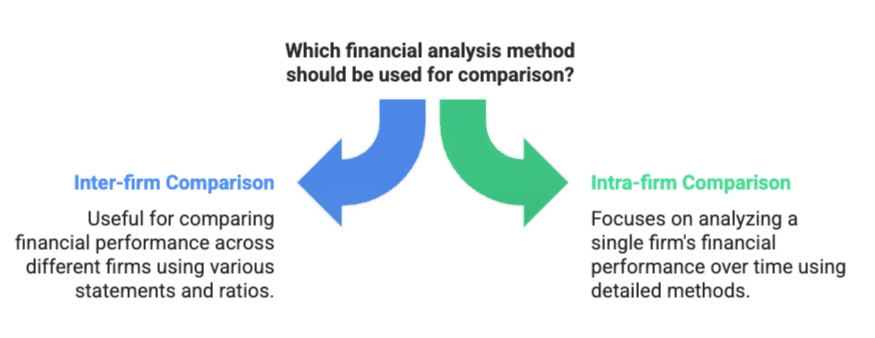
A. Comparison Basis
Inter-firm Comparison
- Comparative Statements (Balance Sheet, Profit and Loss Account)
- Common Size Statements (of the same period)
- Ratios of two or more competitive firms (of the same period)
- Cash Flow Statements of two or more competitive firms
- Graphs (Polygon, Bar Diagram)
Intra-firm Comparison
- Comparative Statements (Balance Sheet, Profit and Loss Account)
- Common Size Statements (of the same period)
- Ratios of two or more competitive firms (of the same period)
- Cash Flow Statements of two or more competitive firms
- Graphs (Polygon, Bar Diagram)
- Horizontal Comparison
- Vertical Comparison
B. Time Basis
Inter-period Comparison
- Comparative Statements (two or more periods)
- Cash Flow Statements (two or more periods)
Cross-Sectional (Intra-period) Comparison
- Common Size Statements
- Ratio Analysis
C. Horizontal Analysis
- Time Series
- Bar Diagrams
- Polygons
- Comparative Statements
- Ratio Analysis
D. Vertical Analysis
- Common Size Statements
- Pie Diagrams
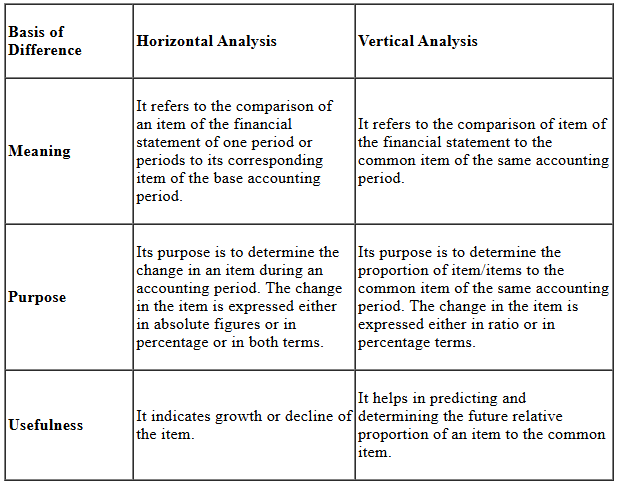
Q2. Distinguish between Vertical and Horizontal Analysis of financial data.
Ans:
Q3. State the meaning of Analysis and Interpretation.
Ans: Analysis and Interpretation involve a systematic examination of financial statements. It aims to:
- Establish cause-and-effect relationships among various items.
- Present financial data clearly and understandably.
- Assist users in assessing the financial performance of a business over time.
- Support decision-making and policy formulation.
Country Man Ltd Comparative Statement as of March 31, 2010 and 2011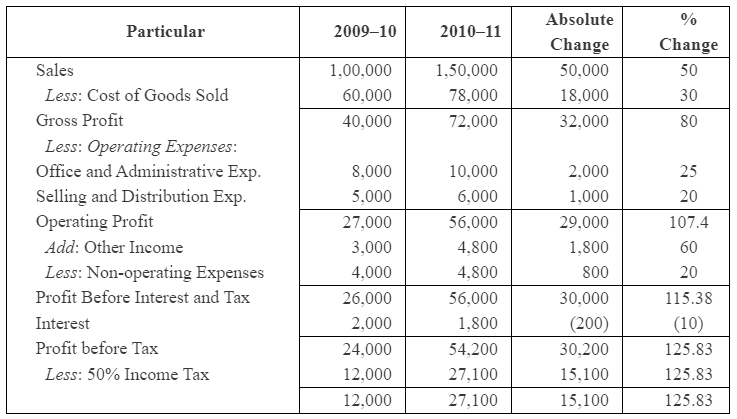
Interpretation:
- Sales increased by 50% in 2010-11, while the cost of goods sold rose at a slower rate. This suggests an effective sales strategy, leading to an 80% increase in gross profit compared to the previous year.
- Operating expenses also rose, but operating profit grew at a faster rate, indicating improved efficiency.
- Profit before interest and tax surged by 115.38% over the two years, reflecting enhanced operational efficiency.
Q4. State the importance of Financial Analysis.
Ans: Financial Analysis is crucial for various users in accounting as it provides insights into a business's financial health. By examining Income Statements, Balance Sheets, and other financial data, stakeholders can understand expenses, income sources, and overall profitability. However, this data must be analysed to be useful. Various tools, such as Ratio Analysis and Cash Flow Statements, help meet the diverse needs of different users. The significance of Financial Analysis can be summarised as follows:
- Evaluates Profitability: It assesses the ability of a business to generate profit and its financial viability.
- Assesses Solvency: It determines the long-term ability of the business to meet its debts.
- Comparative Analysis: It allows a comparison of a firm's financial status with that of competitors.
- Supports Decision-Making: It aids management in making informed decisions, planning, and establishing effective controls.
Q5. What are Comparative Financial Statements?
Ans: Comparative Financial Statements are financial documents that allow for comparisons within a company (intra-firm) and between different companies (inter-firm) over time. They help users assess financial progress in relative terms. Key features of Comparative Financial Statements include:
- Display of absolute figures, changes in these figures, and percentage changes over time.
- Presentation of data in a clear and understandable format, facilitating analysis without confusion.
- Meaningful comparisons are possible only if the same accounting policies are applied consistently over the periods being studied.
Common types of Comparative Financial Statements include:
- Comparative Balance Sheet
- Comparative Income Statement
These statements are essential for identifying trends and changes in financial performance, enabling better decision-making.
Q6. What do you mean by Common Size Statements?
Ans: Common Size Statements are financial tools that show the relationship between different items in financial statements as a percentage of a common figure. This helps in understanding the financial position and performance of a company more clearly. Key features of Common Size Statements include:
- Each item in the Profit and Loss Statement is expressed as a percentage of Net Sales.
- Items in the Balance Sheet are shown as a percentage of the Total Assets or Total Liabilities.
- This percentage format allows for easy comparison with previous years (inter-firm comparison) and with other firms in the same industry.
Common Size Statements are particularly useful for:
- Identifying trends over time when prepared for successive periods.
- Facilitating comparisons between companies of different sizes within the same industry.
Common types of Common Size Statements include:
- Common Size Balance Sheet
- Common Size Income Statement
Overall, these statements provide valuable insights into the structure and performance of a company’s finances.
Long Answer Questions
Q1: Describe the different techniques of financial analysis and explain the limitations of financial analysis.
Ans: The various techniques used in financial analysis are as follows:
- Comparative Statements: These statements depict the figures of two or more accounting years simultaneously, which helps to assess the profitability and financial position of a business. The Comparative Statements help us in analysing the trend of the financial position of the business. These statements also enable us to undertake various types of comparisons, like inter-firm comparisons and intra-firm comparisons. It presents the change in the financial items both in absolute as well as percentage terms. Therefore, these statements help in measuring the efficiency of the business in relative terms. The analyses based on these statements are known as Horizontal Analyses.
- Common Size Statements: These statements depict the relationship between various items of financial statements and some common items (like Net Sales and the Total of Balance Sheet) in percentage terms. In other words, various items of Trading and Profit and Loss Account such as Cost of Goods Sold, Non-Operating Incomes and Expenses are expressed in terms of percentage of Net Sales. On the other hand, different items of the Balance Sheet, such as Fixed Assets, Current Assets, Share Capital, etc., are expressed in terms of the percentage of the Total of the Balance Sheet. These percentage figures are easily comparable with that of the previous years (i.e. inter-firm comparison) and with that of the figures of other firms in the same industry (i.e. inter-firm comparison) as well. The analyses based on these statements are commonly known as Vertical Analysis.
- Trend Analysis: This analysis undertakes the study of trends in the financial positions and the operating performance of a business over a series of successive years. In this technique, a particular year is assumed to be the base year, and the figures of all other years are expressed in percentage terms of the base year's figures. These trends (or the percentage figures) not only help in assessing the operational efficiency and the financial position of the business but also help in detecting the problems and inefficiencies.
- Ratio Analysis: This technique depicts the relationship between various items of the Balance Sheet and the Income Statements. It helps in ascertaining the profitability, operational efficiency, solvency, etc, of a firm. The analysis expresses financial items in terms of percentage, fraction, proportion and number of times. It enables budgetary controls by assessing the qualitative relationship among different financial variables. This analysis provides vital information to different accounting users regarding the financial position, viability and performance of a firm. It also facilitates the decision-making and policy designing process.
- Cash Flow Analysis: This analysis is presented in the form of a statement showing inflows and outflows of cash and cash equivalents from operating, investing and financing activities of a company during a particular period of time. It helps in analysing the reasons of receipts and payments in cash and change in the cash balances during an accounting year in a company.
Limitations of Financial Analysis
The limitations of Financial Analysis are:
- Ignores Changes in the Price level
The financial analysis fails to capture the change in price level. The figures of different years are taken on nominal values and not in real terms (i.e. not taking price change into considerations). - Misleading and Wrong Information
The financial analysis fails to reveal the change in the accounting procedures and practices. Consequently, they may provide wrong and misleading information. - Interim and Final Pictures
The financial analysis presents only the interim report and thereby provides incomplete information. They fail to provide the final and holistic picture. - Ignores Qualitative and Non-monetary Aspects
The financial analysis reveals only the monetary aspects. In other words, these analyses consider only that information that can be expressed in monetary terms. These analyses fail to disclose managerial efficiency, growth prospects, and other non-operational efficiency of a business. - Accounting Concepts and Conventions
The financial analysis is based on accounting concepts and conventions. Therefore, the analysis and conclusions based on such analyses may not be reliable. For example, the analysis considers only the book value of various items (i.e. according to the Going Concept) and consequently ignores the present market value of those items. Hence, the analysis may not be realistic. - Involves Personal Biasness
The financial analysis reflects the personal bias and personal value judgments of the accountants and clerks involved. There are different techniques used by different personnel for charging depreciation (original cost or written-down value method) and for inventory valuation. The use of different techniques by different people reduces the effectiveness of the financial analysis. - Unsuitable for Comparisons
Due to the involvement of personal value judgment, personal bias, and use of different techniques by different accountants, various types of comparisons such as inter-firm and intra-firm comparisons, may not be possible and reliable.
Q2: Explain the usefulness of trend percentages in the interpretation of the financial performance of a company.
Ans: The Trend Analysis presents each financial item in percentage terms for each year. These Trend Analyses not only help the accounting users to assess the financial performance of the business but also assist them to form an opinion about various tendencies and predict the future trend of the business.
Usefulness and Importance of Trend Analysis
The following are the various importance of Trend Analysis:
- Assists in forecasting
The trends provided by Trend Analysis help the accounting users to forecast the future trend of the business. - Percentage Terms
The trends are expressed in percentage terms. Analysing the percentage figures is easy and less time-consuming. - User Friendly
As the trends are expressed in percentage figures, it is the most popular financial analysis to analyse the financial performance and operational efficiency of the company. In other words, one need not have an in-depth and sophisticated knowledge of accounting in order to analyse these percentage trends. - Presents a Broader Picture
The trend analysis presents a broader picture of the financial performance, viability and operational efficiency of a business. Generally, companies prefer to present their financial data for a period of 5 or 10 years in the form of percentage trends, whereas the other techniques of Financial Analysis lack this popularity.
Q3: What is the importance of comparative statements? Illustrate your answer with particular reference to comparative income statements.
Ans: The following are the importance of Comparative Statements.
- Simple Presentation
The Comparative Statements present the financial data in a simpler form. Moreover, the year-wise data of the same items are presented side-by-side, which not only makes the presentation clear but also enables easy comparisons (both intra-firm and inter-firm) to be conclusive. - Easy for Drawing Conclusion
The presentation of the comparative statement is so effective that it enables the analyst to draw conclusions quickly and easily and that too without any ambiguity - Easy to Forecast
The comparative analysis of profitability and operational efficiency of a business over some time helps in analysing the trend and also assists the management to forecast and draft various plans and policy measures accordingly. - Easy Detection of Problems
By comparing the financial data of two or more years, the financial management can easily detect the problems. While comparing the data, some items may have increased while others have decreased or remained constant. The comparative analysis not only enables the management to locate the problems but also helps them to put various budgetary controls and corrective measures to check whether the current performance is aligned with that of the planned targets.
Q4: What do you understand by analysis and interpretation of financial statements? Discuss their importance.
Ans: Financial Analysis has great importance to various accounting users on various matters. Income Statements, Balance Sheets and other financial data provide information about expenses and sources of income, profit or loss and also help in assessing the financial position of a business. These financial data are not useful until they are analysed. There are various tools and methods such as Ratio Analysis, Cash Flow Statements that make the financial data cater to the varying needs of various accounting users.
The following are the reasons that advocate in favour of Financial Analysis:
- It helps in evaluating the profit earning capacity and financial feasibility of a business.
- It helps in assessing the long-term solvency of the business.
- It helps in evaluating the relative financial status of a firm in comparison to other competitive firms.
- It assists management in the decision-making process, drafting various plans and also in establishing an effective controlling system.
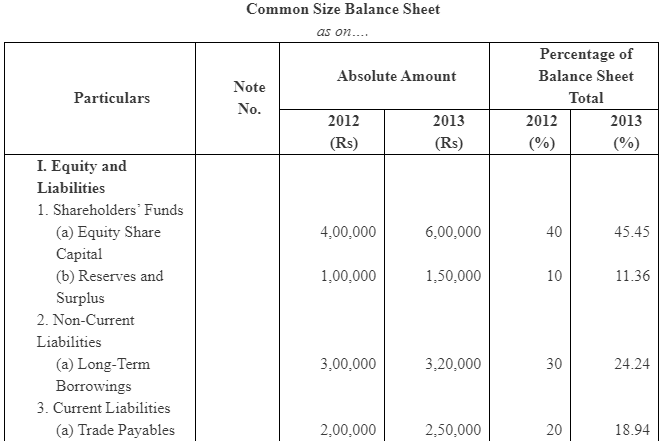
Q5: Explain how common size statements are prepared, giving an example.
Ans: The two Common Size Statements that are most commonly prepared are as follows.
- Common Size Balance Sheet
- Common Size Income Statements
Common Size Statement is prepared in a columnar form for analysis. In a Common Size Statement, each item of the financial statements is compared to a common item. The analyses based on these statements are commonly known as Vertical Analysis.
The following are the columns prepared in a Common Size Statement.
- Particulars Column: This column shows the various financial items under their respective heads.
- Amount Columns: These columns depict the amount of each item, sub-totals and the gross total of a particular year.
- Percentage or Ratio Columns: These columns show the proportion of each item to the common item either in terms of percentage or ratio.
The Common Size Statements can be presented in the following two ways.
Method 1
The Percentage Column is shown beside the Amount Column of the year to which the Percentage Column belongs.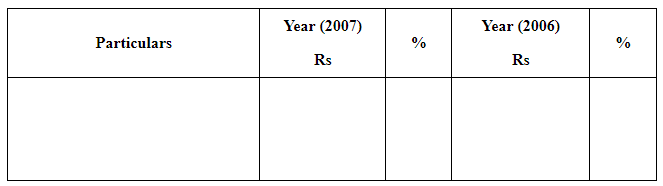
Method 2
Amount Columns are shown first, and their percentage Columns are shown after the Amount Columns.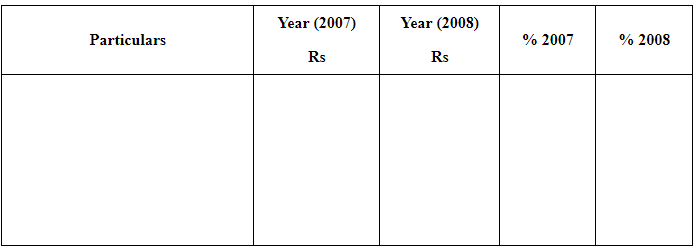
The preparation of the Common Size Statements can be better understood by the help of the following example.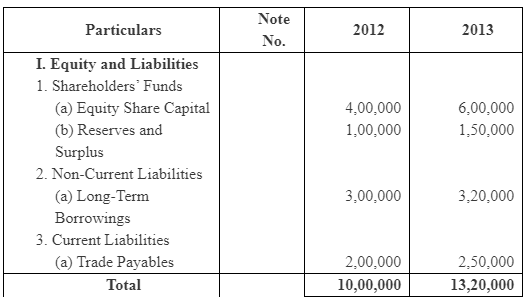
Preparation
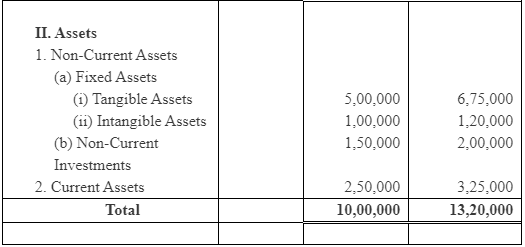
- Step 1: Title of the Common Size Statement, i.e. ‘Common Size Balance Sheet’ is written on the top of the statement.
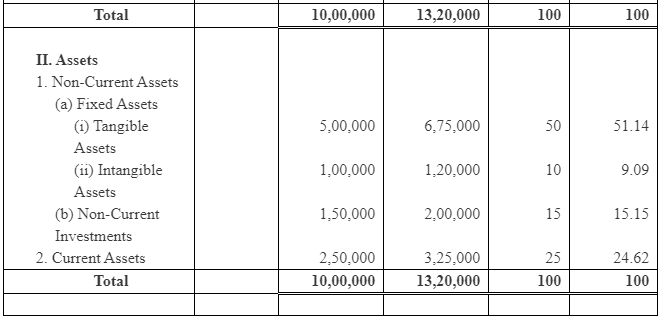
- Step 2: In the ‘Particulars’ column, the various items of the Balance Sheet are shown under the headings of ‘Assets’ and ‘Equity and Liabilities’.
- Step 3: In the ‘Amount’ column, the amount of the items is shown in the ‘Year’ column to which they belong
- Step 4: The Assets and Liabilities are totaled and are shown separately for each year.
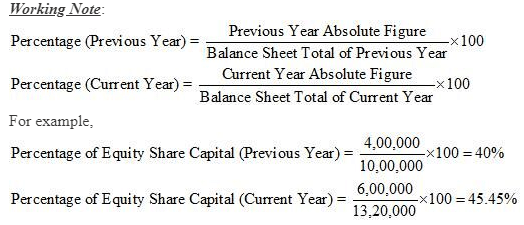
- Step 5: In the ‘Percentage’ column, the percentage of each item in comparison to the Total of the Balance Sheet is shown.
|
42 videos|199 docs|43 tests
|
FAQs on Analysis of Financial Statements- 1 NCERT Solutions - Accountancy Class 12 - Commerce
| 1. What are the key components of financial statements? |  |
| 2. How can financial statements help in decision-making? | |
| 3. What is the significance of ratio analysis in financial statements? | |
| 4. How do you prepare a financial statement analysis report? | |
| 5. What are the limitations of financial statements? | |


Previous Year Questions with Solutions
,study material
,shortcuts and tricks
,Sample Paper
,Analysis of Financial Statements- 1 NCERT Solutions | Accountancy Class 12 - Commerce
,MCQs
,Summary
,practice quizzes
,Exam
,Objective type Questions
,Analysis of Financial Statements- 1 NCERT Solutions | Accountancy Class 12 - Commerce
,mock tests for examination
,Viva Questions
,Analysis of Financial Statements- 1 NCERT Solutions | Accountancy Class 12 - Commerce
,Free
,Important questions
,Semester Notes
,past year papers
,ppt
,Extra Questions
,video lectures
;


NCERT Solutions: Analysis of Financial Statements- 1 Free PDF Download
Importance of NCERT Solutions: Analysis of Financial Statements- 1
NCERT Solutions: Analysis of Financial Statements- 1 Notes
NCERT Solutions: Analysis of Financial Statements- 1 Commerce Questions
Study NCERT Solutions: Analysis of Financial Statements- 1 on the App
|
© EduRev
|
Education Revolution
|


|


