Properties of Soils - 2 | Civil Engineering SSC JE (Technical) - Civil Engineering (CE) PDF Download
Chapter 1 (Part 2)
Properties of Soils:
METHODS FOR THE DETERMINATION OF INSITU UNIT WEIGHT:
Unit weight is necessary to compute overburden pressure at any depth within a soil.
The various methods are:
(a) Core-Cutter method
-Used in case of non-cohesive soils.
-Cannot be used in case of hard and gravely soils.
-Method consists of driving a core-cutter (Volume = 1000 cc) into the soil and and removing it, the cutter filled with soil is weighed. Volume of cutter is known from its dimensions and in situ unit weight is obtained by diving soil weight by volume of cutter.
-If water content is known in laboratory, the dry unit weight can also be computed. 
(b) Sand Replacement Method:
-Sand replacement method is used to determine in-place dry density of natural or compacted fine-and medium-grained soils. This method is applicable to layers not exceeding 15 cm in thickness.
-Used in case of hard and gravely soils.
-A hole in ground is made. The excavated soil is weighed.The volume of the hole is determined by replacing it with sand and insitu unit weight is obtained by dividing weight of excavated soil by its volume.
(c) Water Displacement Method:
-Water displacement test method is used to determine the dry density of soil. It is suitable for evaluating in-place dry density of cohesive soil due to the nature of specimen required.
-The soil sample should be trimmed to obtain a regular shape and then coated it to make it impervious to water. After that, the total volume of the waxed specimen is found by determining the volume of water displaced by the specimen.
-Suitable for cohesive soils only, where it is possible to have a lump sample.
-A regular shape, well trimmed sample is weighed (W1). It is coated with paraffin wax & again weighed (W2). The sample is now placed in a metal container filled with water upto the brim. Now placed in a metal container filled with water upto the brim. Let the volume of displaced water be Vw.
Then volume of uncoated specimen,V is calculated as
V = Vw - 
where, gp = unit wt. of paraffin wax
Dry density=(W1/V)/1+w
w= Water content
GRAIN SIZE DISTRIBUTION:
Grain size analysis/particle size analysis involves the following methods:
(i) For coarse grained soils - sieve analysis further, for coarser of coarse - Dry sieve analysis for finer of coarse- Wet sieve analysis
(ii) For fine grained soils- sedimentation analysis, It involves two methods: (a) Hydrometer method (b) Pipette method.
Sieve Analysis: (For Coarse Grained Soils): The fraction retained on 4.75 mm sieve is called the gravel fraction which is subjected to coarse sieve analysis.
The material passing 4.75 mm sieve is further subjected to fine sieve analysis if it is sand or to a combined sieve and sedimentation analysis if slit and clay sizes are also present.
Concept of %age retained on a particular sieve:
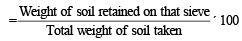
Cumulative % retained: Sum of % retained on all sieves of larger sizes and the % retained on that particular sieve.
Percentage finer than the sieve under reference = 100%- Cumulative % retained.
Sedimentation Analysis: According to stokes law, the terminal velocity is given by,
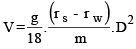
r s = density of grains (g/cm3)
r s = density of water (g/cm3)
m = viscosity of water
g = acceleration due to gravity (cm/s2)
D = Diameter of grain (cm)
By putting the values at 20ºC, we get,
V=91D2, where v is in cm/s and D is in mm,
NOTE:
-Stokes law is applicable for spheres of diameter between 0.2 mm and 0.0002 mm.
-Spheres of diameter larger than 0.2 mm falling through water cause turbulence, whereas, for spheres with diameter less than 0.0002 mm, Browning motion takes place and the velocity of settlement is too small for accurate measurement.
-Pipette Method In this method, the weight of solids per cc of suspension is determined directly by collecting 10 cc of soil suspension from a specified sampling depth.
If md = dry mass (obtained after drying the sample) then mass present in unit vol. of pipette
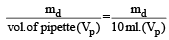
If Md = total mass of soil dissolved in total volume of water (V) then mass/ unit volume =
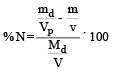
Therefore, % finer is given by =
If m is the mass of dispersing agent dissolved in the total volume V, then actual % finer,
Hydrometer method:In this method the weight of solids present at any time is calculated indirectly by reading the density of soil suspension.
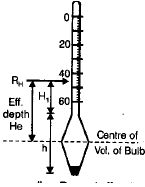
Calibration of Hydrometer: Establishing a relation between the hydrometer reading RH and effective depth (He).
The effective depth is the distance from the surface of the soil suspension to the level at which the density of soil suspension is being measured. Effective depth is calculated as
where,
He=H1+1/2(h-Vh/Aj)
Aj=Area of the cross-section of the jar
Vh= Volume of the hydrometer bulb
H1=Distance in cm between any hydrometer reading Rh and the neck
If Rc is the corrected hydrometer reading,the specific gravity of soil suspension is equal to 1+Rc/100.
It is also equal to the right hand side of the equation below
1+Rc/100=(wt. of water/cc+immersd wt of solids/cc)/wt of water/cc) = 1+immersed wt of solids/cc =1+Wd(Gs-1/Gs)
Wd=(Gs/Gs-1). Rc/100
-Correction to Hydrometer Reading
(i) Meniscus correction: (Cm) Hydrometer reading is always corresponding to the upper level of meniscus.
(ii) Temperature correction: (Ct) Hydrometers are generally calibrated at 27ºC . If the test temperature is above the standard (27ºC) then the correction is added and, if below, it is subtracted.
(iii) Dispersing/Defloculating agent correction: (Cd) The correction due to rise in specific gravity of the suspension on account of the additon of the defloculating agent is called Dispersing agent correction (Dd).
Cd is always negative.
The corrected hydrometer reading is given by (RH ) = RH +Cm ±Ct- Cd
-Grain size Distribution Curves:
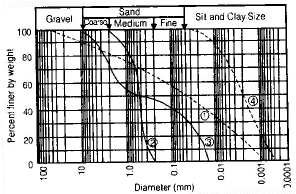
Curve-1: Well graded soil: Good representation of grain size over a wide range and its gradation curve is smooth.
Curve-2: Poorly graded soil/Uniform gradation :
It is either an excess or a deficiency of certain particle sizes or has most of the particles about the same size.
Curve-3: Gap graded soil: In this case some of the particle sizes are missing.
Curve-4: Predominantly coarse soil.
Curve-5: Predominantly fine soil.
If slope of the curve is steep, soil is poorly graded, If slope is inclined, soil is well graded.
The diameter D10 corresponds to 10% of the sample finer in weight on the Grain size distribution curve. This diameter D10 is called effective size.
Similarly, D30 and D60 are grain dia. (mm) corresponding to 30% fine and 60% finer.
The shape parameters related to these are
(a) Coefficient of Uniformity

(b) Coefficient of Curvature

For a soil to be well graded: [1 < CC <3] and [Cu > 4] for gravels; [Cu > 6] for sands.
Cu > 1 for uniform soils / poorly graded soils.
CONSISTENCY OF CLAYS : ATTERBERG LIMITS
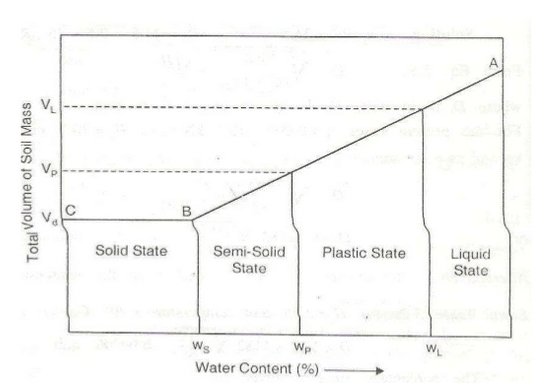
Wl = liquid limit
Wp = plastic limit
Ws = Shrinkage limit
Plasticity Index (IP): It is the range of moisture content over which a soil exhibits plasticity.
Ip = Wl-Wp
WL = Water content at LL
WP = Water content at PL
Clay soils possessing high values of liquid limit and plasticity index are referred to as highly plastic or fat clays and those with low values are described as lean clays.Coarse grained soils cannot achieve the plastic state of consistency and their liquid limit and plastic limit may be said to coincide;that is Ip=0.When the liquid limit or the plastic limit cannot bedetermined,the plasticity index is reported as Non plastic.When the plastic limit is equal to or greater than the liquid limit,Ip is reported as zero.
Relative Consistency or Consistency- Index (IC)
When Wn=Wl, Ic=0
When Wn=Wp,Ic=1
If Ic is negative,the natural water content of soil is greater than the liquid limit, and the soil mass behaves like a liquid, but only upon disturbance.
If Ic is greater than 1,the soil is in a semi-solid or solid state and will be very stiff or hard.
Liquidity index (II)
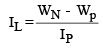
For soil in plastic state IL varies from 0 to 1.
| consist | Description | Ic | IL |
| Liquid Plastic | Liquid Very Soft Soft medium Stiff Stiff | <0 0-0.25 0.25- 0.5 0.50-0.75 0.75-1.00 | >1 |
| semi-solid | Very Stiff OR Hard | > 1 | < 0 |
| Solid | Hard OR Very Hard | > 1 | <0 |
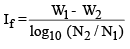
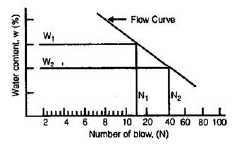
Flow Index (If)
Toughness Index (If)

When It <1, the soil is friable (easily crushed) at the plastic limit.
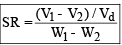
Shrinkage Ratio (SR)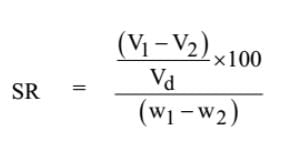
Where, V1 = volume of soil mass at water content W1%
V2 = volume of soil mass at water content W2%
Vd = Volume of dry soil mass
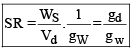
Now, at SL, W2 = WS and V2 = Vd;hence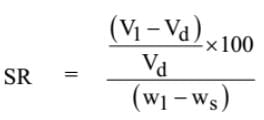
If w1 & w2 are expressed as ratios(water content corresponding to V1 and V2)
But,w1 - w2
STRESS STRAIN CURVE FOR DIFFERENT CONSISTENCY STATES:
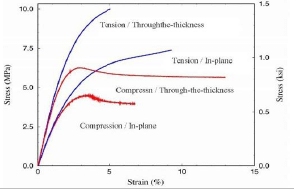
-Unconfined Compressive Strength (qu) defined as the load per unit area at which an unconfined prismatic or cylindrical specimen of standard dimensions a soil fails in a simple compression test.
qu = 2 × Shear strength of a clay soil (under undrained condition). qu = is related to consistency os clays as:
| Consistency | Qu (KN/M2) | ( Kg/Cm2) |
| Very Soft | < 25 | < 0.25 |
| Soft | 25-50 | 0.25 - 0.50 |
| Medium | 50-100 | 0.50 -1.0 |
| Stiff | 100-200 | 1.0 - 2.0 |
| Very Stiff | 200 - 400 | 2.0 - 4.0 |
| Hard | > 400 | > 4.0 |
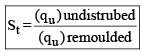
Sensitivity (St): It is defined as the ratio of the unconfined compressive strength of an undisturbed specimen of the soil to the unconfined compressive strength of a specimen of the same soil after remolding at unaltered water content.
Soil classification based on sensitivity:
| Sensitivity | Classification |
| 1-4 | Normal |
| 4-8 | Sensitive |
| 8-16 | Extra-Sensitive |
| > 16 | Quick |
Thixotropy: It is the property of certain clays by virtue of which they regain, if left alone for a time, a part of the strength lost due to remolding, at unaltered moisture content.
Higher the sensitivity, larger the thixotropic hardening.
Relative Density/Density Index:
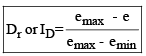
Where, emax = Void ratio in loosest state
emin = Void ratio in densest state
e = Void ratio in natural state
Relative density based classification of Granular soils
| ID (%) | Classification |
| 0-15 | Very loose |
| 15-35 | Loose |
| 35-65 | Medium |
| > 85 | Very Dense |
using relation

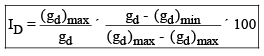
where,
(gd)max = max dry unit weight
(gd)min = min dry unit weight dry unit weight in natural state of the deposit
The values of emax and emin for a granular soil assuming the soil grains as spherical and uniform in size is given as:
emax=0.91
emin=0.35
|
2 videos|122 docs|55 tests
|
FAQs on Properties of Soils - 2 - Civil Engineering SSC JE (Technical) - Civil Engineering (CE)
| 1. What are the different types of soil properties? |  |
| 2. How does soil texture affect plant growth? | |
| 3. What is soil pH and why is it important? | |
| 4. How does soil structure impact drainage? | |
| 5. How does organic matter affect soil fertility? | |

|
2.3K Views |

|
4.84/5 Rating |

|
Dec 22, 2024 Last updated |
|
2 videos|122 docs|55 tests
|

|
Explore Courses for Civil Engineering (CE) exam
|
|
study material
,Viva Questions
,ppt
,Objective type Questions
,past year papers
,Semester Notes
,Important questions
,MCQs
,Properties of Soils - 2 | Civil Engineering SSC JE (Technical) - Civil Engineering (CE)
,mock tests for examination
,Exam
,Properties of Soils - 2 | Civil Engineering SSC JE (Technical) - Civil Engineering (CE)
,Sample Paper
,Free
,shortcuts and tricks
,Extra Questions
,video lectures
,Properties of Soils - 2 | Civil Engineering SSC JE (Technical) - Civil Engineering (CE)
,practice quizzes
,Previous Year Questions with Solutions
,Summary
,


Properties of Soils - 2 Free PDF Download
Importance of Properties of Soils - 2
Properties of Soils - 2 Notes
Properties of Soils - 2 Civil Engineering (CE) Questions
Study Properties of Soils - 2 on the App
|
© EduRev
|
Education Revolution
|


|


