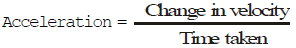
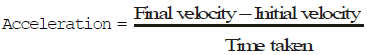
Graphical Representation of Motion and Equations of Motions by Graphical Method

Equations of Uniformly Accelerated Motion
These equations give a relationship between initial velocity, final velocity, time taken, acceleration and distance travelled by the bodies.
First Equation of Motion
A body having an initial velocity 'u' acted upon by a uniform acceleration 'a' for time 't' such that final velocity of the body is 'v'.

v - u = at v = u + at
Where ; v = final velocity of the body u = initial velocity of the body
a = Acceleration t = time taken
Second Equation of Motion
It gives the distance travelled by a body in time t.
A body having an initial velocity 'u' acted upon by a uniform acceleration 'a' for time 't' such that final velocity of the body is 'v' and the distance covered is 's'.
The average velocity is given by :-
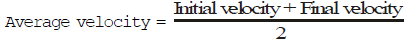
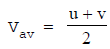
distance covered = average velocity × time 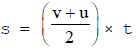
but v = u + at (from first equation of motion)
Thus, 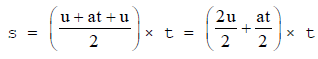
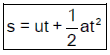
Where ; s = distance travelled by the body in time t
u = initial velocity of the body
a = Acceleration
t = time taken
Third Equation of Motion
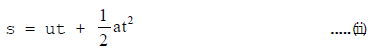
A body having an initial velocity 'u' moving with a uniform acceleration 'a' for time 't' such that final velocity 'v' and the distance covered is 's'. the third equation of motion is v2 = u2 + 2at. it gives the velocity acquired by a body in travelling a distance s.
v = u + at .....(i)
Squaring eq. (i), we have
v2 = (u + at)2
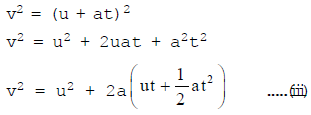
Substituting the value of eq (ii) in eq.(iii), we get. v2 = u2 + 2as
Important Points for solving Numericals
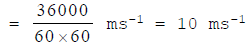
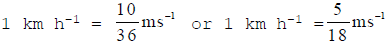
- Distance in kilometres should be converted into metre.
- Before solving problems, ensure that the data provided have the same system of unit, i.e. either they should be in SI system or CGS system.
- If a body start from rest, its initial velocity (u) is zero, (u =0)
- If a moving body comes to rest/stops, its final velocity (v) is zero, (v =0)
- If a body is moving with uniform velocity, its acceleration is zero, (a =0)
- If the body is falling under gravity, the value of acceleration should be taken -g.
Graphical Representation of Motion
Graph
A graph is a line, straight line or curved, showing the relation between two variable quantities of which one varies as a result of the change in the other.
The quantity which changes independently is called independent variable and the one which changes as a result of the change in the other is called dependent variable.
Plotting a Graph
- Take independent varibale along X-axis and dependent variable along Y-axis.
- Choose convenient scale so that more than 2/3rd of graph is filled.
- Draw free hand curve to join them.
Uses of Graphs
- It gives a bird's eye view of the changes.
- It is used to show dependence of one quantity on the other e.g., distance or velocity on time.
- We can find distance covered in a given time.
- Slope of velocity-time graph gives acceleration.
- We can find position or velocity of body at any instant.
Competitive Window
|
Distance/Displacement-Time Graph
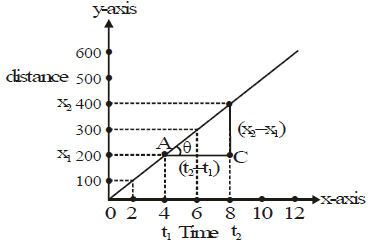
This graph is plotted between the time taken and the distance covered, the time is taken along the x-axis and the distance covered is taken along the y-axis.
Speed = distance/time
- The slope of the distance-time graph gives the speed of the body.
- The slope of the displacement-time graph gives the velocity of the body.
When the body is at Rest
When position of the body does not change with time then it is said to be stationary, the distance-time graph of such a body is a straight line parallel to x-axis.
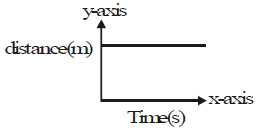
Distance-time graph for a Stationary Body
When the body is in Uniform Speed
When the position of the body changes by equal intervals of time then body is said to be moving with uniform speed. The distance-time graph of such a body is a straight line, inclined to x-axis.
Special Case-I
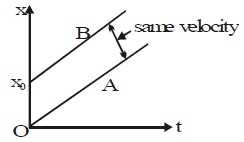
In uniform motion along a straight line the position x of the body at any time t is related to the constant velocity as,
xA = vt Starting form zero
xB = x0 + vt starting from x0
Special Case-II
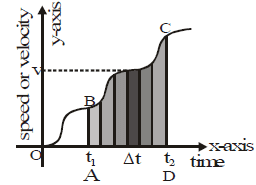
Slope of line A = tanθA = tan0 (∵ θA = 0)
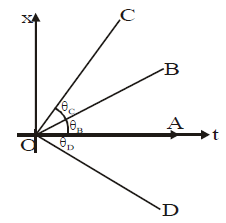
=> zero velocity
Slope of line B = tanθB = positive velocity
Slope of line C = tanθc = more positive velocity
∵ θC> θB (tanθC> θB )
Then vC> vB
Slope of line D = tan (-θD) = negative velocity.
When the body is in Motion with a Non-uniform (or Variable) Speed
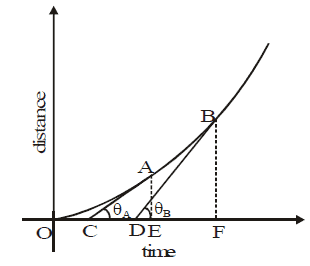
Distance-Time graph for a body moving with non-unifrom speed.
The position-time graph is not a straight line, but is a curve.
The speed of the body at any point is known as instantaneous speed and can be calculated by finding the slope at that point.
So instantaneous speed of the body at point A.
Slope at point A = tanθA = AE \ CE
instantaneous speed of the body at point B
Slope at point B = tanθB = BF\DF
θB> θA so slope at point B is greater than the slope at point A.
Hence speed of body at point B is a greater than, the speed of body at point A.
When the Speed Decreases with Passage of Time
Slope at point A > slope at point B (θA> θB)
So, speed at point A > speed at point B
Acceleration from Displacement-time Graph
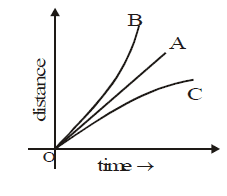
For line A : A straight line displacement-time graph represents a
uniform velocity and zero acceleration
for line B : A curved displacement-time graph rising upward represents an increasing velocity and positive acceleration
For line C : A curved displacement-time graph falling downwards, represents a decreasing velocity and negative acceleration.
Velocity-time Graph
The variation in velocity with time for an object moving in a straight line can be represented by a velocity-time graph. In this graph, time is represented along the x-axis and velocity is represented along the y-axis.
Acceleration = (speed or velocity over time)
hence the slope of the speed/velocity-time graph, gives the acceleration of the body.
Distance = speed × time
hence, area enclosed between the speed-time graph line and x-axis (time axis) gives the distance covered by the body. Similarly area enclosed between the velocity-time graph line and the x-axis (time axis) gives the displacement of the body.
Note: Since the graph takes into account, only the magnitude hence velocity-time graph is not different from speed-time graph.
When the body is moving with Constant Velocity
When the body moves with constant velocity i.e. its motion is uniform.
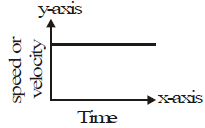
The speed or velocity of the body is uniform hence the magnitude remains same. The graph is a straight line parallel to x-axis (time-axis). Since the velocity is uniform. Its acceleration is zero. The slope of the graph in this case is zero.
Conclusion: Velocity-time graph of a body moving with constant velocity is a straight line parallel to time axis.
When the body is moving with Uniform Acceleration
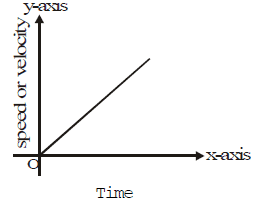
The speed or velocity is changing by equal amounts in equal interval of time, the speed or velocity time graph of such a body is a straight line inclined to x-axis (time-axis).
When the body is moving with a Non-uniform (or Variable) Acceleration
The speed or velocity-time graph is not a straight line but is a curve.
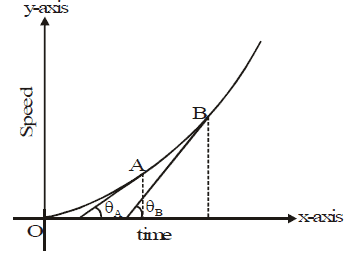
The line has different slopes at different times, its acceleration is variable. At point A, slope is less hence acceleratoin is less. At point B slope is more hence acceleration is more.
Note: Speed or velocity-time graph line can never be paralled to y-axis (speed axis), because slope angle becomes 90° than tan90° is infinite it is impossible.
Distance or Displacement from Speed or Velocity-time Graph.
As distance or displacement = speed or velocity x time, hence the distance or displacement can be calculated from speed or velocity-time graph.
When Speed or Velocity is Uniform (or Constant)
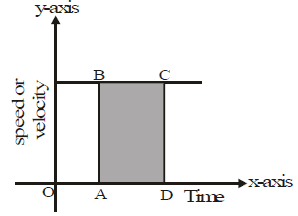
Distance/displacement = Area of rectangle ABCD = AB × AD
Thus, We find that the area enclosed by velocity-time graph and the time axis gives the distance travelled by the body.
When Acceleration is Uniform (or Constant)
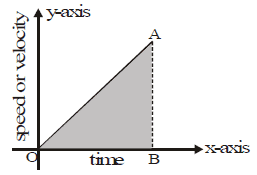
distance or displacement = area of right triangle OAB =
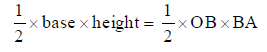
When Speed or Velocity as well as Acceleration is Non-uniform (or Variable).
The speed-time graph of a body moving irregularly with variable speed and acceleration. For a small interval of time Δt, as there is not much change in speed, hence the speed can be taken as constant.
For this small time interval.
Distance Δs = vΔt = Area of the blackened strip.
For whole time interval between t1 and t2, distance = sum of areas of all the strips, between t1 and t2 = area of shaded figure ABCD.
Applications of Velocity-time Graphs
A number of useful results can be deduced from velocity time graph.
- Slope of velocity-time graph gives the acceleration.
- Area below velocity-time graph and the time axis gives the distance covered.
- Using the above two results, we can derive all equations of motion.
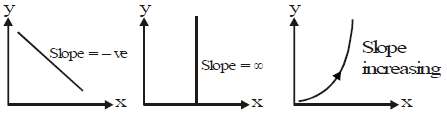
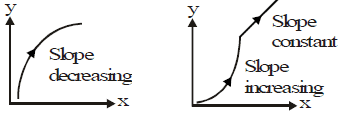
Nature of Slopes
Competitive Window
Equations of Motion by Graphical Method
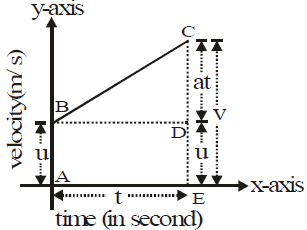
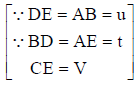
Represents a velocity-time graph BC, in which AB represents the initial velocity u, CE represents final velocity v, such that the change in velocity is represented by CD, which takes place in time t, represented by AE.
Derivation of Velocity-time Relation (v = u + at)
Acceleration = slope of the graph line BC.
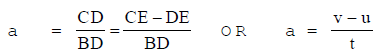
v - u = at
v = u + at
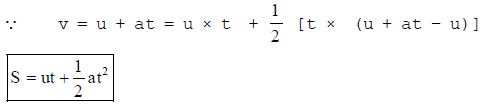
Derivation of Position-time Relation (s = ut + 1/2 at2)
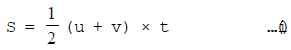
Distance travelled = Area of trapezium ABCE
= Area of rectangle ABDE + Area of triangle BCD

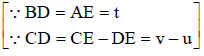
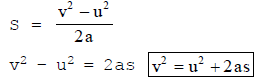
Derivation of Position-Velocity Relation (v2= u2 + 2as)
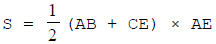
From the velocity-time graph distance covered = Area of trapezium ABCE
Substituting the value of t in eq (i)
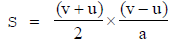 ∵ A2 - B2 = (A + B) × (A - B)
FAQs on Graphical Representation of Motion and Equations of Motions by Graphical Method
| 1. What are the equations of uniformly accelerated motion? |  |
| 2. What is the graphical representation of motion? | |
| 3. How can we use graphical method to find equations of motion? | |
| 4. What is the significance of equations of motion in physics? | |
| 5. What are some real-life applications of uniformly accelerated motion? | |