Mean - Statistics, CBSE, Class 10, Mathematics PDF Download

INTRODUCTION
In class IX, we have studied about the presentation of given data in the form of ungrouped as well as grouped frequency distributions. We have also studied how to represent the statistical data in the form of various graphs such as bar graphs, histograms and frequency polygons. In addition, we have studied the measure of central tendencies such as mean, median and mode of ungrouped data.
In this chapter, we shall discuss about mean, median and mode of grouped data. We shall also discuss the concept of cumulative frequency, cumulative frequency distribution and cumulative frequency curve (ogive).
MEAN OF UNGROUPED DATA
We know that the mean of observations is the sum of the values of all the observations divided by the total number of observations i.e.,  are n observations, then
mean, 
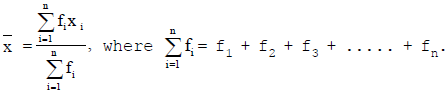
or  denotes the sum
The arithmetic mean of grouped data may also be calculated by any one of the following methods :
1. Direct method
2. Short-cut method or Assumed-mean method
3.Step-deviation method.
MEAN OF GROUPED DATA
DIRECT METHOD
are observations with respective frequencies 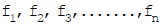 then mean,
  defined by
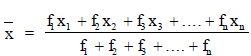
or
To find mean of grouped Data
The following steps should be followed in finding the arithmetic mean of grouped data by direct method.
STEP - 1 :Find the class mark (xi) of each class using, 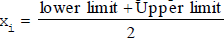
STEP - 2 : Calculate fixi for each i
STEP - 3 : Use the Formula : mean, 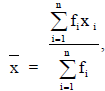
SHORTCUT METHOD OR ASSUMED MEAN METHOD
In this case, to calculate the mean, we follow the following steps :
STEP-1 :Find the class mark xi of each class using
STEP-2 :Choose a suitable value of xi in the middle as the assumed mean and denote it by 'a'.
STEP-3 :Find di = xi – a for each i
STEP-4 :Find fi × di for each i
STEP-5 :Find  fi
fi
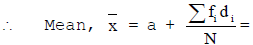
STEP-6 :Calculate the mean, (x) by using the formula 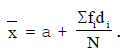
STEP-DEVIATION METHOD
Sometimes, the values of x and f are so large that the calculation of mean by assumed mean method becomes quite inconvenient. In this case, we follow the following steps:
STEP-1 :Find the class mark xi of each class by using
STEP-2 :Choose a suitable values of xi in the middle as the assumed mean and denote it by 'a'.
STEP-3 :Find h = (upper limit –lower limit) for each class.
STEP-4 :Find  for each class.
STEP-5 :Find fiui for each i.
STEP-6 :Calculate, the mean by using the formula 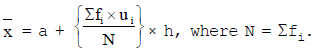
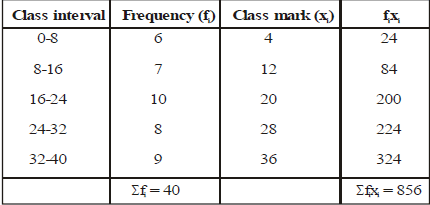
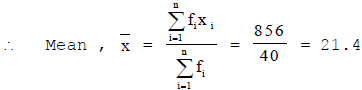
Ex.1 Find the mean of the following data :
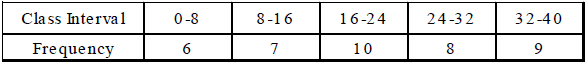
Sol. We may prepare the table as given below :
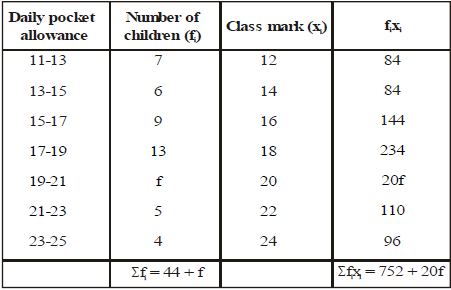
Ex.2 The following distribution shows the daily pocket allowance of children of a locality. The mean pocket allowance is Rs. 18. Find the missing frequency f. 
Sol. We may prepare the table as given below :
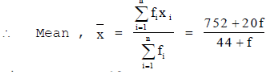
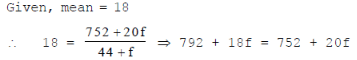 = 2f = 40 ⇒ f = 20
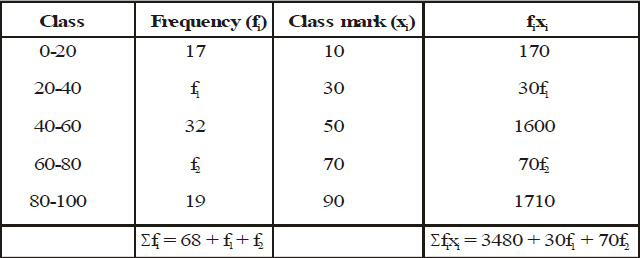
Ex.3 Find the missing frequencies f1 and f2 in the table given below, it is being given that the mean of the given frequency distribution is 50.

Sol. We may prepare the table as given below :
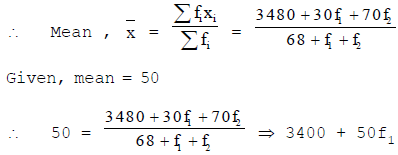 + 50f2 = 3480 + 30f1 + 70f2
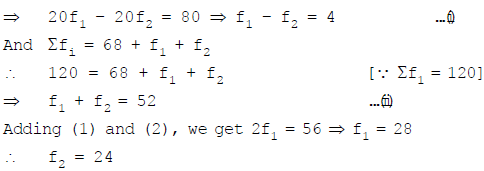
Hence, the missing frequencies f1 and f2 are 28 and 24 respectively.
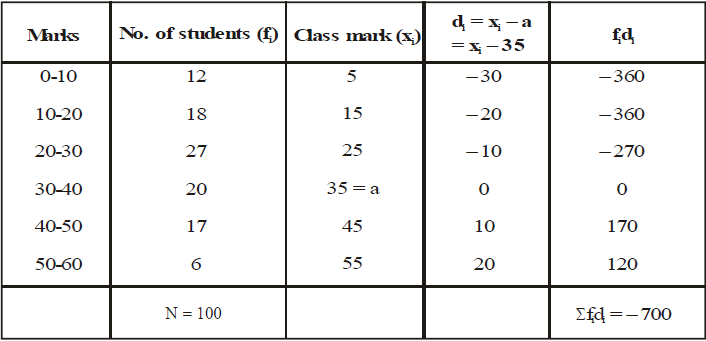
Ex.4 The following table gives the marks scored by 100 students in a class test :

Find the mean marks scored by a student in class test.
Sol. We may prepare the table with assumed mean, a = 35 as given below :

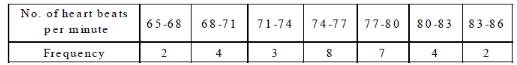
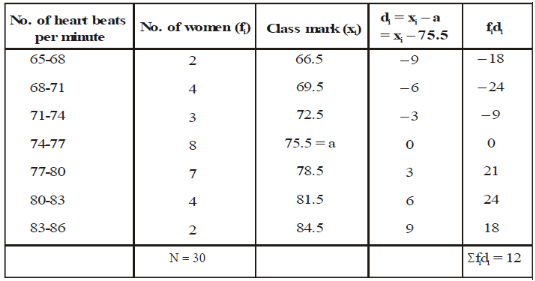
Ex.5 Thirty women were examined in a hospital by a doctor and the number of heart beats per minute, were recorded and summarised as follows. Find the mean heart beats per minute for these women, by using assumed mean method.
Sol. We may prepare the table with assumed mean, a = 75.5 as given below :

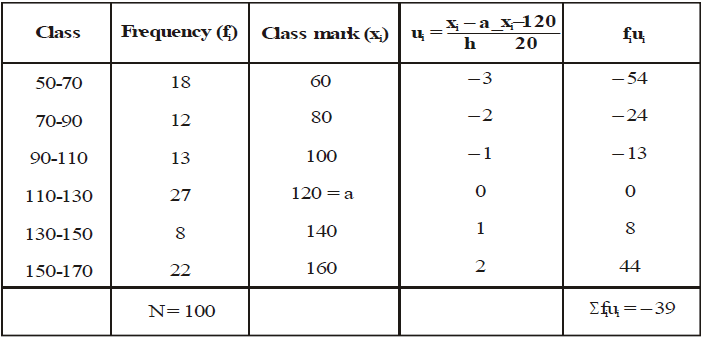
Ex.6 Find the mean of the following distribution by step-deviation method :

Sol. We may prepare the table with assumed mean a = 120 and h = 20 as given below :

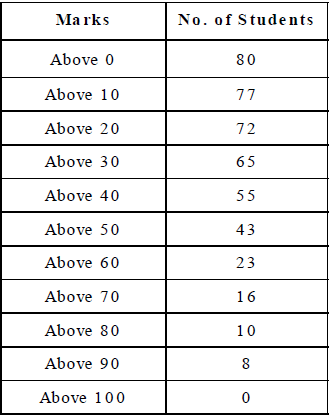
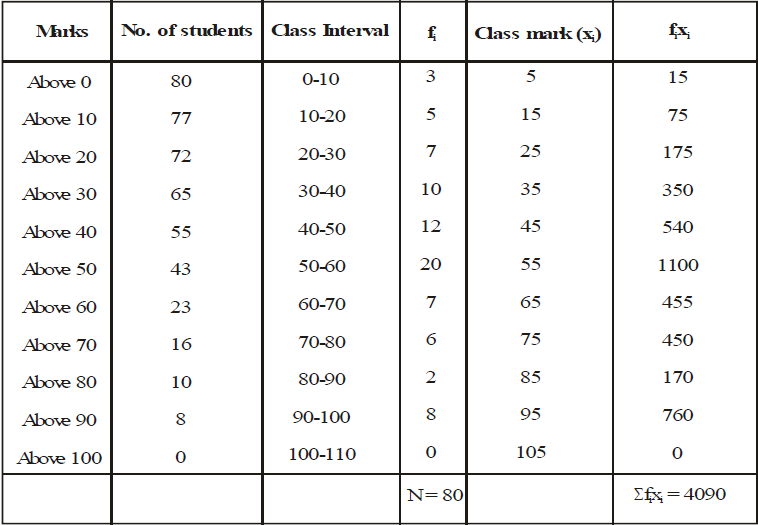
Ex.7 Find the mean marks from the following data :

Sol. We may prepare the table as given below :
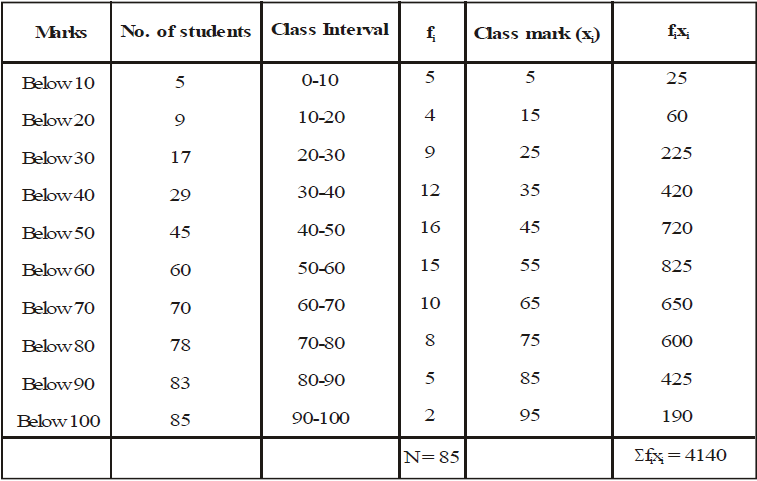
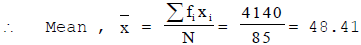
Ex.8 Find the mean marks of students from the adjoining frequency distribution table.
Sol. We may prepare the table as given below :

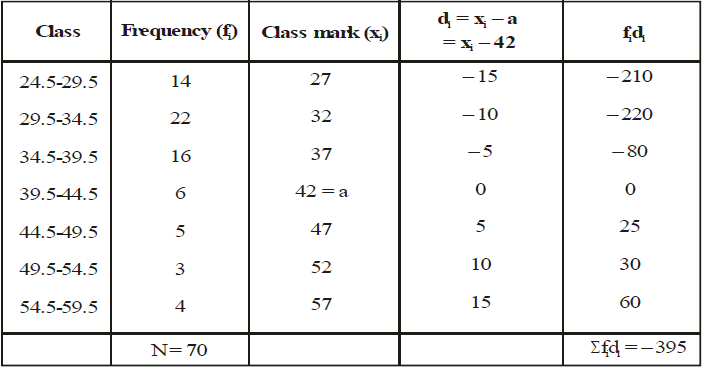
Ex.9 Find the arithmetic mean of the following frequency distribution.

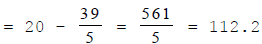
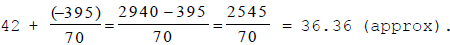
Sol. The given series is in inclusive form. We may prepare the table in exclusive form with assumed mean a = 42 as given below :
FAQs on Mean - Statistics, CBSE, Class 10, Mathematics
| 1. What is the definition of mean in statistics? |  |
| 2. How is the mean calculated in statistics? | |
| 3. What is the purpose of calculating the mean in statistics? | |
| 4. Can the mean be affected by extreme values in a dataset? | |
| 5. How does the mean differ from the median and mode in statistics? | |


Class 10
,MCQs
,past year papers
,practice quizzes
,Mathematics
,study material
,ppt
,shortcuts and tricks
,Extra Questions
,Semester Notes
,Exam
,CBSE
,Class 10
,Important questions
,Viva Questions
,mock tests for examination
,Previous Year Questions with Solutions
,CBSE
,Summary
,Class 10
,CBSE
,Mean - Statistics
,Mathematics
,Sample Paper
,Objective type Questions
,Mathematics
,Mean - Statistics
,Mean - Statistics
,Free
,video lectures
;


Mean - Statistics, CBSE, Class 10, Mathematics Free PDF Download
Importance of Mean - Statistics, CBSE, Class 10, Mathematics
Mean - Statistics, CBSE, Class 10, Mathematics Notes
Mean - Statistics, CBSE, Class 10, Mathematics Class 10 Questions
Study Mean - Statistics, CBSE, Class 10, Mathematics on the App
|
© EduRev
|
Education Revolution
|


|


