Inequalities | Mathematics (Maths) for JEE Main & Advanced PDF Download
| Table of contents |
|
| Inequality Symbols |
|
| Rules of Inequalities |
|
| Interval Notation for Inequalities |
|
| Graph for Inequalities |
|

Inequalities are mathematical expressions that show the relationship between two values when they are not equal i.e., one side can be greater or smaller than the other. We use inequalities in our daily lives in many places such as:
- You must be at least 18 years old to vote i.e., age ≥ 18 for voting.
- The speed limit on the highway is 65 mph. This means you must drive at or below 65 mph: Speed ≤ 65
- You must be at least 48 inches tall to ride this rollercoaster.
- To qualify for a loan, your income must be greater than $40,000 per year.
Inequality Symbols
Inequality symbols are listed below: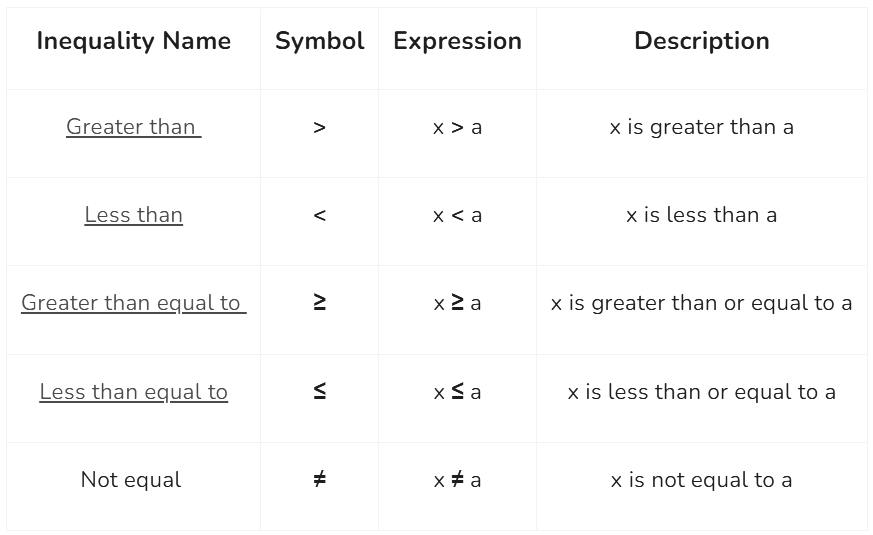
Rules of Inequalities
There are various rules in inequalities to help us relate to and solve various different inequalities. Some of these rules are discussed as follows:
Rule 1
If a, b, and c are three numbers then, inequality between these numbers follows transitive property.
- If a > b and b > c, then a > c
- If a < b and b < c, then a < c
- If a ≥ b and b ≥ c, then a ≥ c
- If a ≤ b and b ≤ c, then a ≤ c
Rule 2
If the LHS and RHS of the expressions are exchanged, then the inequality reverses. It is called converse property.
- If a > b, then b < a
- If a < b, then b > a
- If a ≥ b, then b ≤ a
- If a ≤ b, then b ≥ a
Rule 3
If the same constant k is added or subtracted from both sides of the inequality, then both sides of the inequality are equal.
- If a > b, then a + k > b + k
- If a > b, then a – k > b – k
Similarly, for other inequalities.
- If a < b, then a + k < b + k
- If a < b, then a – k < b – k
- If a ≤ b, then a + k ≤ b + k
- If a ≤ b, then a – k ≤ b – k
- If a ≥ b, then a + k ≥ b + k
- If a ≥ b, then a – k ≥ b – k
The direction of the inequality does not change after adding or subtracting a constant.
Rule 4
If k is a positive constant that is multiplied or divided by both sides of the inequality, then there is no change in the direction of the inequality.
- If a > b, then ak > bk
- If a < b, then ak < bk
- If a ≤ b, then ak ≤ bk
- If a ≥ b, then ak ≥ bk
If k is a negative constant that is multiplied or divided by both sides of the inequality, then the direction of inequality gets reversed.
- If a > b, then ak < bk
- If a > b, then ak < bk
- If a ≥ b, then ak ≤ bk
- If a ≤ b, then ak ≥ bk
Rule 5
The square of any number is always greater than or equal to zero.
- a2 ≥ 0
Rule 6
Taking square roots on both sides of the inequality does not change the direction of the inequality.
- If a > b, then √a > √b
- If a < b, then √a < √b
- If a ≥ b, then √a ≥ √b
- If a ≤ b, then √a ≤ √b
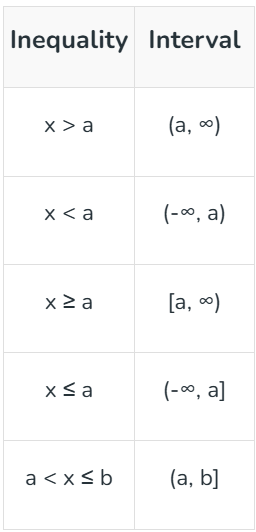
Interval Notation for Inequalities
Important points for writing intervals for inequalities:
- In case of greater than and equal to (≥) or less than equal to (≤), the end values are included so, closed or square brackets [ ] are used.
- In case of greater than (>) or less than (<), the end values are excluded so, open brackets () are used.
- For both positive and negative infinity open brackets () are used.
The following table represents intervals for different inequalities:
Graph for Inequalities
Inequalities are either with one variable or two or we have a system of inequalities, all of them can be graphed to the cartesian plane if it only contains two variables. Inequalities in one variable are plotted on real lines and two variables are plotted on the cartesian plane.
Graph for Linear Inequalities with One Variable
From the following table we can understand, how to plot various Linear Inequalities with One Variable on a real line.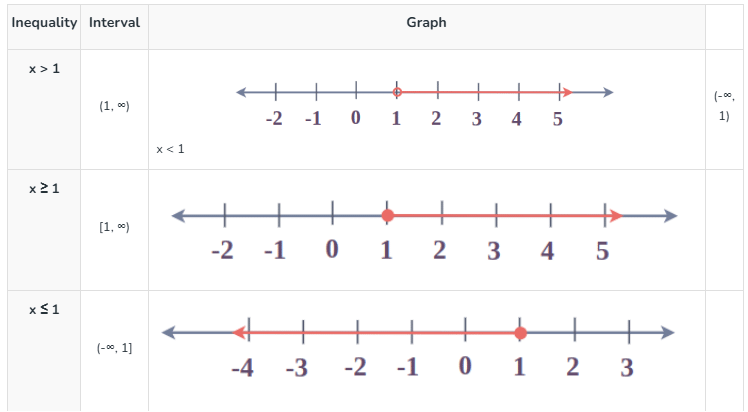
Graph for Linear Inequalities with Two Variable
Let’s take an example of linear inequalities with two variables.
Consider the linear inequality 20x + 10y ≤ 60, as the possible solutions for given inequality are (0, 0), (0,1), (0, 2), (0,3), (0,4), (0,5), (0,6), (1,0), (1,1), (1,2), (1,3), (1,4), (2,0), (2,1), (2,2), (3,0), and also all the points beyond these points are also the solution of the inequality.
Let’s plot the graph from the given solutions.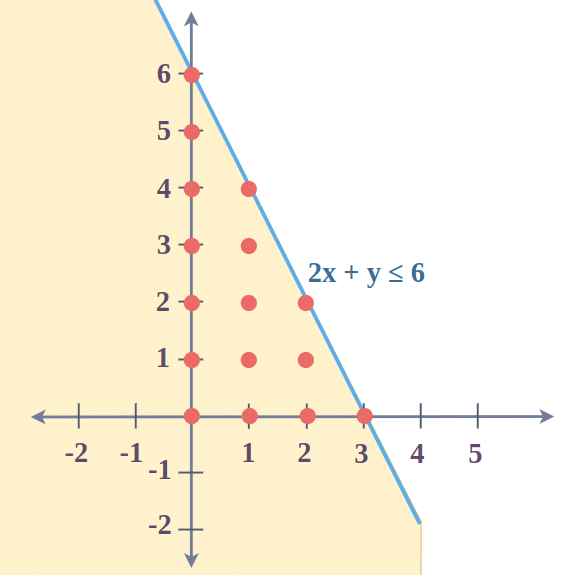
The shaded region in the graph represents the possible solutions for the given inequality.
|
172 videos|476 docs|154 tests
|
FAQs on Inequalities - Mathematics (Maths) for JEE Main & Advanced
| 1. What is the Arithmetico-Geometric Mean Inequality and how is it applied? |  |
| 2. How does Cauchy-Schwartz's inequality work? | |
| 3. What is Tchebychef’s Inequality and its significance? | |
| 4. Can you explain the Weierstrass Inequality? | |
| 5. How is the Logarithm Inequality applied in problem-solving? | |


mock tests for examination
,past year papers
,study material
,Important questions
,Objective type Questions
,Exam
,Summary
,Free
,Inequalities | Mathematics (Maths) for JEE Main & Advanced
,Inequalities | Mathematics (Maths) for JEE Main & Advanced
,Viva Questions
,Semester Notes
,Sample Paper
,practice quizzes
,video lectures
,MCQs
,Previous Year Questions with Solutions
,ppt
,Inequalities | Mathematics (Maths) for JEE Main & Advanced
,shortcuts and tricks
,Extra Questions
;


Inequalities Free PDF Download
Importance of Inequalities
Inequalities Notes
Inequalities JEE Questions
Study Inequalities on the App
|
© EduRev
|
Education Revolution
|


|


