Bode Diagram - Electrical Engineering (EE) PDF Download

Bode Diagram
The Bode diagrams are a convinient way of representing the frequency response characteristics of a system. A Bode diagram consists of a pair of plots that show how the amplitude ratio and phase shift vary with frequency of the signal that perturbs a process. In order to cover a large range of frequency, a logarithmic scale of representation is employed.
Bode Diagram of a first order process
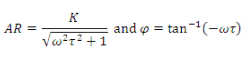
The first order process has the following characteristics:
 135
135
The Bode Diagram of a first order process is shown in the following figure.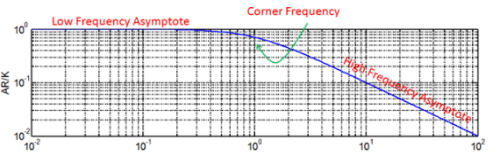
Expressing AR with logarithmic representation,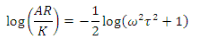 136
136
We encounter the following two terminal situations:
• As  and hence
 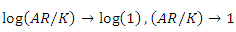 . That means at very low frequency, the profile of AR approaches a constant value (equal to gain K of the system) with slope zero. This is termed as low frequency asymptote .
• As 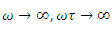 and hence
 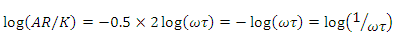 . That means at very high frequency, the profile of AR approaches a value which is inverse of the frequency. This is termed as high frequency asymptote .
• The two asymptotes meet at a point where  . The frequency
  is termed as corner frequency .
• The profile of amplitude ratio transits from one asymptote to the other and the deviation of the true value of AR is maximum from its asymptote(s) at the corner frequency.
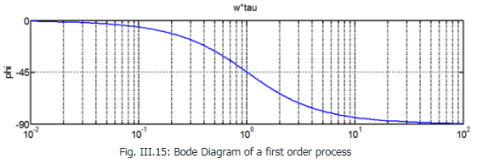
The profile of phase shift can be analyzed in the similar manner:
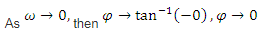
• As  then
then 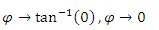
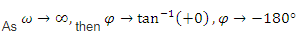
• As  then
then 
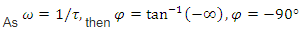
• As  then
then 
Note that the gain does not have any effect on the phase shift.
Bode Diagram of a second order process
The second order process has the following characteristics:
 137
137
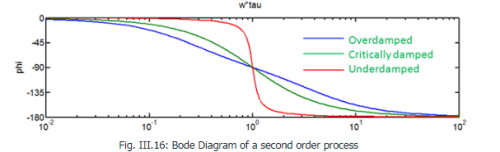
The Bode Diagram of a second order process is shown in the following figure.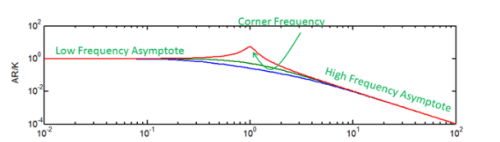
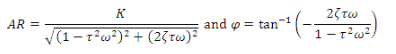
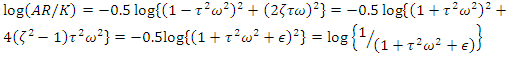
Expressing with logarithmic representation,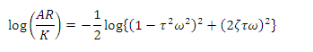 138
138
We encounter the following two terminal situations:
• As  and hence
  . That means at very low frequency, the profile of AR approaches a constant value with slope zero. This is low frequency asymptote .
•As 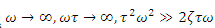 and hence
  .That means at very high frequency, the profile of approaches a value which is inverse of the square of the frequency. This is high frequency asymptote .
• The two asymptotes meet at corner frequency 
• The profile of amplitude ratio will have three different shapes that depends upon the value of the damping coefficient. It is understood that 
• For overdamped process  ,
, 
where  is a non-negative quantity. Hence,
 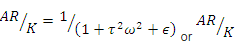 is always less than one.
• For critically damped process  ,
, 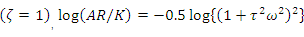 . Hence
  is always less than 1
• For underdamped process 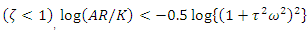 Hence there will be some values of frequency where
  is greater than 1
The profile of phase shift can be analyzed in the similar manner:
• 
• 
• 
Note that the phase shift leaps by a full -900 as the order of the process increases by one.
FAQs on Bode Diagram - Electrical Engineering (EE)
| 1. What is a Bode diagram? |  |
| 2. How is a Bode diagram useful in system analysis? | |
| 3. How can I interpret the magnitude plot of a Bode diagram? | |
| 4. What does the phase plot of a Bode diagram represent? | |
| 5. How can I use a Bode diagram to design a control system? | |


ppt
,Important questions
,Exam
,Semester Notes
,video lectures
,Bode Diagram - Electrical Engineering (EE)
,Sample Paper
,past year papers
,Summary
,mock tests for examination
,MCQs
,Extra Questions
,Bode Diagram - Electrical Engineering (EE)
,Objective type Questions
,Free
,practice quizzes
,study material
,shortcuts and tricks
,Previous Year Questions with Solutions
,Viva Questions
,Bode Diagram - Electrical Engineering (EE)
;


Bode Diagram Free PDF Download
Importance of Bode Diagram
Bode Diagram Notes
Bode Diagram Electrical Engineering (EE) Questions
Study Bode Diagram on the App
|
© EduRev
|
Education Revolution
|


|


