Bode Diagram of pure time delay - Electrical Engineering (EE) PDF Download

Bode Diagram of pure time delay
It is worth to study the frequency response characteristics of pure time delay  that has
  and
and  . The following figure shows the Bode Diagram of pure time delay.
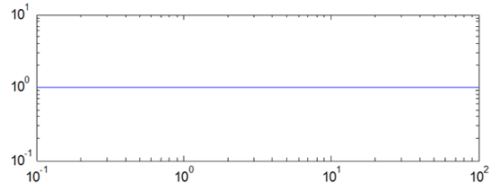
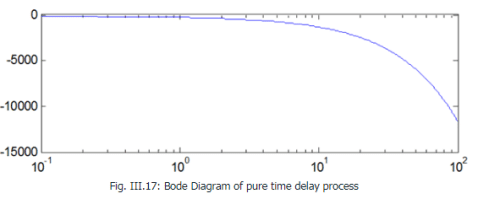
Note that  as
as  .
.
Bode Diagram for processes in series
Let G1 and G2 are two processes in series. Let signals f1 and f2 be the input and output of the process G1 and G2 signals f2 and f3 be the input and output of the process G2.(see the following figure).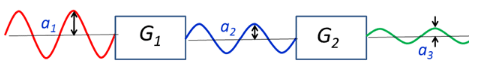
The amplitude ratio of G1 is  and the amplitude ratio of G2 is
  . The overall amplitude ratio of the combined process G1G2 should be a3/a1. Hence,
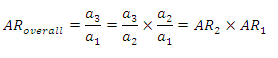 141
141
or
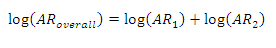 142
142
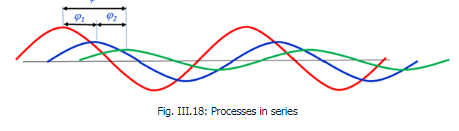
Similarly the overall phase shift for the combined process is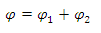 143
143
The processes in series can be studied individually and their individual characteristics can be combined as per the equations above. Note that the individual processes will have their own asymptotes along with the corresponding corner frequencies.
FAQs on Bode Diagram of pure time delay - Electrical Engineering (EE)
| 1. What is a Bode diagram? |  |
| 2. How is a Bode diagram useful in analyzing systems? | |
| 3. What does a pure time delay represent in a Bode diagram? | |
| 4. How does a pure time delay affect system stability? | |
| 5. Can a Bode diagram be used to approximate the time delay of a system? | |


Bode Diagram of pure time delay - Electrical Engineering (EE)
,Bode Diagram of pure time delay - Electrical Engineering (EE)
,Bode Diagram of pure time delay - Electrical Engineering (EE)
,Free
,Summary
,Important questions
,mock tests for examination
,Viva Questions
,Extra Questions
,Semester Notes
,study material
,practice quizzes
,shortcuts and tricks
,ppt
,MCQs
,Exam
,video lectures
,past year papers
,Sample Paper
,Objective type Questions
,Previous Year Questions with Solutions
;


Bode Diagram of pure time delay Free PDF Download
Importance of Bode Diagram of pure time delay
Bode Diagram of pure time delay Notes
Bode Diagram of pure time delay Electrical Engineering (EE) Questions
Study Bode Diagram of pure time delay on the App
|
© EduRev
|
Education Revolution
|


|


