Test: Tabulation - Bank Exams MCQ
18 Questions MCQ Test - Test: Tabulation

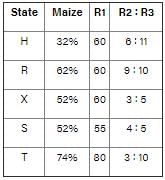
Direction: The table given below shows the production of maize by 5 different states as a percentage of total production. Each state produces only maize and rice. There are three types of rice - R1, R2 and R3. The table also shows the R1 type of rice produced as a percentage of total rice production and the ratio of R2 and R3 type of rice. Total production by each state is 625000.
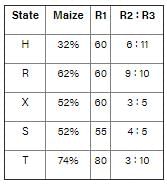
A = Average of the R3 type of rice produced by state H, R, S and X together.
B = Difference between the R2 type of rice produced by state T and R1 type of rice produced by state R.
What is the value of K/F? (where K = Average of the total production of R1 type of rice by all the states and F = Total production of R2 type of rice by all the states.)
A = Average of the R3 type of rice produced by state H, R, S and X together.
B = Difference between the R2 type of rice produced by state T and R1 type of rice produced by state R.
Direction: The table given below shows the production of maize by 5 different states as a percentage of total production. Each state produces only maize and rice. There are three types of rice - R1, R2 and R3. The table also shows the R1 type of rice produced as a percentage of total rice production and the ratio of R2 and R3 type of rice. Total production by each state is 625000.

A = Average of the R3 type of rice produced by state H, R, S and X together.
B = Difference between the R2 type of rice produced by state T and R1 type of rice produced by state R.
What is the value of B - A?
B = Difference between the R2 type of rice produced by state T and R1 type of rice produced by state R.

Direction: The table given below shows the production of maize by 5 different states as a percentage of total production. Each state produces only maize and rice. There are three types of rice - R1, R2 and R3. The table also shows the R1 type of rice produced as a percentage of total rice production and the ratio of R2 and R3 type of rice. Total production by each state is 625000.

A = Average of the R3 type of rice produced by state H, R, S and X together.
B = Difference between the R2 type of rice produced by state T and R1 type of rice produced by state R.
Production of R3 type of rice by state X is what percentage of production of R1 type of rice by state S?
A = Average of the R3 type of rice produced by state H, R, S and X together.
B = Difference between the R2 type of rice produced by state T and R1 type of rice produced by state R.
Direction: The table given below shows the production of maize by 5 different states as a percentage of total production. Each state produces only maize and rice. There are three types of rice - R1, R2 and R3. The table also shows the R1 type of rice produced as a percentage of total rice production and the ratio of R2 and R3 type of rice. Total production by each state is 625000.

A = Average of the R3 type of rice produced by state H, R, S and X together.
B = Difference between the R2 type of rice produced by state T and R1 type of rice produced by state R.
What is the sum of the total production of maize by state X and T and total production of R2 type of Rice by state S and R?
Direction: The table given below shows the production of maize by 5 different states as a percentage of total production. Each state produces only maize and rice. There are three types of rice - R1, R2 and R3. The table also shows the R1 type of rice produced as a percentage of total rice production and the ratio of R2 and R3 type of rice. Total production by each state is 625000.
A = Average of the R3 type of rice produced by state H, R, S and X together.
B = Difference between the R2 type of rice produced by state T and R1 type of rice produced by state R.
What is the difference between the R1 type of rice produced by state X and the R2 type of rice produced by state H?
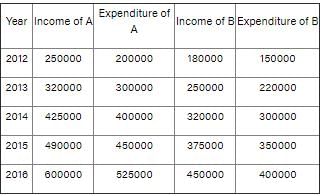
Direction: The table given below shows the income and expenditure (in Rs) of two companies A and B form 2012 to 2016.
Also, Profit = Income - Expenditure
and Profit% = [(Income - Expenditure)/Expenditure] × 100

What is the ratio of profit of A in year 2013 and profit of B in year 2016 respectively?
Direction: The table given below shows the income and expenditure (in Rs) of two companies A and B form 2012 to 2016.
Also, Profit = Income - Expenditure
and Profit% = [(Income - Expenditure)/Expenditure] × 100

What is the average yearly profit (in Rs) of A for the given years?
Direction: The table given below shows the income and expenditure (in Rs) of two companies A and B form 2012 to 2016.
Also, Profit = Income - Expenditure
and Profit% = [(Income - Expenditure)/Expenditure] × 100

For which year the profit percentage of B is the highest?
Direction: The table given below shows the income and expenditure (in Rs) of two companies A and B form 2012 to 2016.
Also, Profit = Income - Expenditure
and Profit% = [(Income - Expenditure)/Expenditure] × 100
If the income and expenditure of A increases by same rate in 2017 over 2016 as they did in 2016 over 2015, then what is its profit percentage (approximate) in 2017?
Direction: The table given below shows the income and expenditure (in Rs) of two companies A and B form 2012 to 2016.
Also, Profit = Income - Expenditure
and Profit% = [(Income - Expenditure)/Expenditure] × 100
Compare the profit of Company A wrt to Company B for the year 2014 and find out which company is leading and find profit as well.
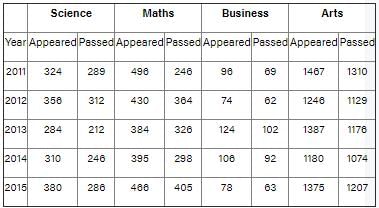
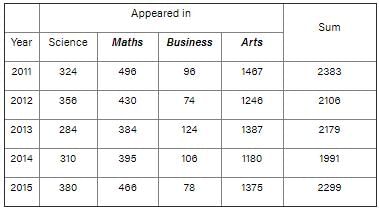
Directions : Study the following table which shows the number of candidates appeared and passed indifferent streams in a School and answer the questions given below it
The number of students appearing in all streams was minimum in the year
Directions : Study the following table which shows the number of candidates appeared and passed indifferent streams in a School and answer the questions given below it
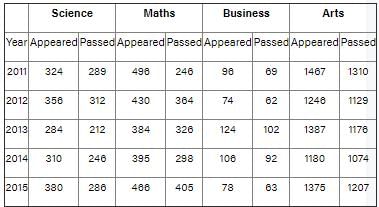
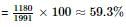
Approximately what per cent of total students appearing in 2014, appeared in Arts stream?
Directions : Study the following table which shows the number of candidates appeared and passed indifferent streams in a School and answer the questions given below it
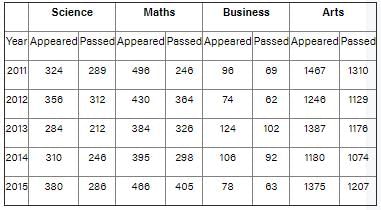
Approximately what percent of students appearing in Maths, passed in 2013?
Directions: Study the following table and answer the questions: Population of a locality from 1988 to 1992
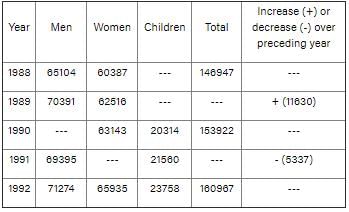
What is the ratio of children and men in 1992?
Directions: Study the following table and answer the questions: Population of a locality from 1988 to 1992
Number of women in 1991 is:
Directions: Study the following table and answer the questions: Population of a locality from 1988 to 1992
Number of children in 1989 is:
Directions: Study the following table and answer the questions: Population of a locality from 1988 to 1992
What is the population of men in 1990?
Directions: Study the following table and answer the questions: Population of a locality from 1988 to 1992
The number of children in 1988 is


Important Questions for Tabulation
Tabulation MCQs with Answers
Online Tests for Tabulation
|
© EduRev
|
Education Revolution
|


|


