Class 5 Exam  >  Class 5 Tests  >  Test: Smart Charts - 1 - Class 5 MCQ

Test: Smart Charts - 1 - Class 5 MCQ


Test Description

10 Questions MCQ Test - Test: Smart Charts - 1

Test: Smart Charts - 1 for Class 5 2024 is part of Class 5 preparation. The Test: Smart Charts - 1 questions and answers have been prepared according to the Class 5 exam syllabus.The Test: Smart Charts - 1 MCQs are made for Class 5 2024 Exam. Find important definitions, questions, notes, meanings, examples, exercises, MCQs and online tests for Test: Smart Charts - 1 below.
Solutions of Test: Smart Charts - 1 questions in English are available as part of our course for Class 5 & Test: Smart Charts - 1 solutions in Hindi for Class 5 course. Download more important topics, notes, lectures and mock test series for Class 5 Exam by signing up for free. Attempt Test: Smart Charts - 1 | 10 questions in 10 minutes | Mock test for Class 5 preparation | Free important questions MCQ to study for Class 5 Exam | Download free PDF with solutions
Test: Smart Charts - 1 - Question 1

Direction: The given bar graph shows the number of residents in 6 cities. Study the graph and answer the question.
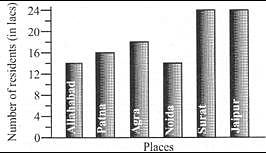
Q. There were 18 lacs residents residing in ____.

Detailed Solution for Test: Smart Charts - 1 - Question 1

 It appears that the height of the bar representing Agra is  at the 18 lacs mark on the vertical axis, suggesting that Agra has 18 lacs residents.

Test: Smart Charts - 1 - Question 2

Direction: The given bar graph shows the number of residents in 6 cities. Study the graph and answer the question.
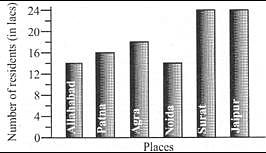
Q. How many more residents were residing in Surat than in Agra?

Detailed Solution for Test: Smart Charts - 1 - Question 2

 It appears that the height of the bar representing Agra is  at the 18 lacs mark on the vertical axis and height of the bar representing Surat is  at the 24  lacs mark on the vertical axis.So if we calculate the difference between residents so its 24 lacs - 18 lacs= 6 lac residents

1 Crore+ students have signed up on EduRev. Have you? Download the App
Test: Smart Charts - 1 - Question 3

Direction: The given bar graph shows the number of residents in 6 cities. Study the graph and answer the question.

Q. How many residents were there altogether in the 6 cities?

Detailed Solution for Test: Smart Charts - 1 - Question 3

 Looking at the height of the bar representing particular city resident  mark on the vertical axis
Residents of Allahabad = 14 lacs
Residents of Patna =  16 lacs
Residents of Agra = 18 lacs
Residents of Noida = 14 lacs
Residents of Surat = 24 lacs
Residents of Jaipur = 24 lacs
So the sum total of all the residents will be = 14 lacs + 16 lacs + 18 lacs + 14 lacs + 24 lacs + 24 lacs = 110 lacs

Test: Smart Charts - 1 - Question 4

Direction: The given bar graph shows the number of viewers who watched the 4 channels. Study the graph and answer the question.
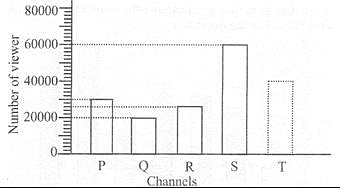
Q. How many more viewers watched Channel S than Channel Q?

Detailed Solution for Test: Smart Charts - 1 - Question 4

We can see
Channel Q is corresponding to 20000 viewers 
Channel S  is corresponding to 60000 viewers. 
The difference between the viewers of  channel S and Channel Q = 60000-20000 = 40000
Therefore, 40000 more  viewers watched Channel S than Channel Q.

Test: Smart Charts - 1 - Question 5

Direction: The given bar graph shows the number of viewers who watched the 4 channels. Study the graph and answer the question.
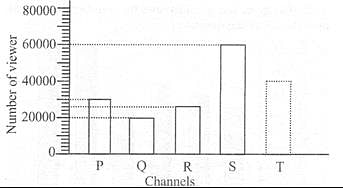
Q. There were 150000 viewers altogether. How many viewers watched Channel T?

Detailed Solution for Test: Smart Charts - 1 - Question 5

Total viewers = 1,50,000
No of viewers who watched P, Q, R, S = 30,000 + 20,000 + 26,000 + 60,000 = 1,36,000
No of viewers watched T = 1,50,000 - 1,36,000 = 14000

Test: Smart Charts - 1 - Question 6

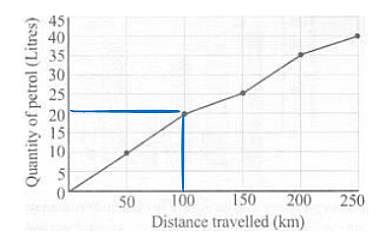
Direction: The Sine graph shows the quantity of petrol Ankit used and the distance his car travelled. Study the graph answer the question.
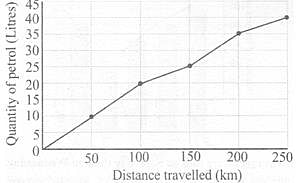
Q. What distance was travelled with 20 litres of petrol?

Detailed Solution for Test: Smart Charts - 1 - Question 6


From the given chart, the distance travelled with 20 liters of petrol = 100 km.

Test: Smart Charts - 1 - Question 7

Direction: The Sine graph shows the quantity of petrol Ankit used and the distance his car travelled. Study the graph answer the question.
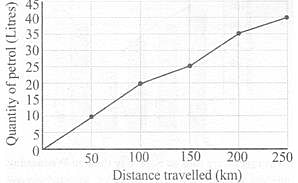
What distance was travelled with 25 litres of petrol?

Detailed Solution for Test: Smart Charts - 1 - Question 7

From the given chart we can see 25 L petrol is corresponding to 150 km in distance.

Test: Smart Charts - 1 - Question 8

Direction: The Sine graph shows the quantity of petrol Ankit used and the distance his car travelled. Study the graph answer the question.
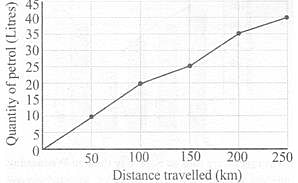
Q. What distance was travelled with 35 litres of petrol?

Detailed Solution for Test: Smart Charts - 1 - Question 8

From the given graph, we can see 35 L of petrol is corresponding to 200 km.

Test: Smart Charts - 1 - Question 9

Direction: Study the graph and answer the question.
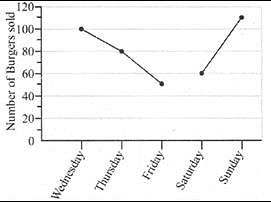
Q. The sum of the greatest number of burgers and the smallest number burgers sold is

Detailed Solution for Test: Smart Charts - 1 - Question 9

We can see that the highest number of burgers were sold on Sunday, that is 110 burgers.

Similarly, the lowest level level of burgers sold were on Friday, that is 50 burgers.

Therefore, the sum is 110 + 50 = 160 burgers

Test: Smart Charts - 1 - Question 10

Direction: Study the graph and answer the question.
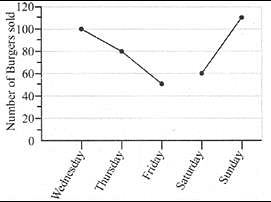
Q. Find the difference between the burgers sold on Wednesday and Saturday?

Detailed Solution for Test: Smart Charts - 1 - Question 10

The difference between the burgers sold on Wednesday and Saturday is 40.
As Burgers sold on Wednesday = 100
Burgers sold on Saturday = 60
Difference = 40

Information about Test: Smart Charts - 1 Page
In this test you can find the Exam questions for Test: Smart Charts - 1 solved & explained in the simplest way possible. Besides giving Questions and answers for Test: Smart Charts - 1, EduRev gives you an ample number of Online tests for practice

Top Courses for Class 5

Download as PDF

Top Courses for Class 5