Class 5 Exam  >  Class 5 Tests  >  Olympiad Test : Pictorial Representation Of Data - Class 5 MCQ

Olympiad Test : Pictorial Representation Of Data - Class 5 MCQ


Test Description

20 Questions MCQ Test - Olympiad Test : Pictorial Representation Of Data

Olympiad Test : Pictorial Representation Of Data for Class 5 2024 is part of Class 5 preparation. The Olympiad Test : Pictorial Representation Of Data questions and answers have been prepared according to the Class 5 exam syllabus.The Olympiad Test : Pictorial Representation Of Data MCQs are made for Class 5 2024 Exam. Find important definitions, questions, notes, meanings, examples, exercises, MCQs and online tests for Olympiad Test : Pictorial Representation Of Data below.
Solutions of Olympiad Test : Pictorial Representation Of Data questions in English are available as part of our course for Class 5 & Olympiad Test : Pictorial Representation Of Data solutions in Hindi for Class 5 course. Download more important topics, notes, lectures and mock test series for Class 5 Exam by signing up for free. Attempt Olympiad Test : Pictorial Representation Of Data | 20 questions in 40 minutes | Mock test for Class 5 preparation | Free important questions MCQ to study for Class 5 Exam | Download free PDF with solutions
Olympiad Test : Pictorial Representation Of Data - Question 1

The bar graph shows the results when a die was thrown a number of times.
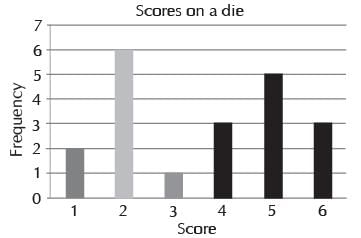

Q. ​How many sixes were thrown?

Detailed Solution for Olympiad Test : Pictorial Representation Of Data - Question 1

The number of sixes is given by its frequency, or how high the bar is for the score 6. So, look for 6 across the horizontal axis and then read off its frequency on the vertical axis. There were 3 sixes.

Olympiad Test : Pictorial Representation Of Data - Question 2

The bar graph shows the favorite colors of 20 students in a class.
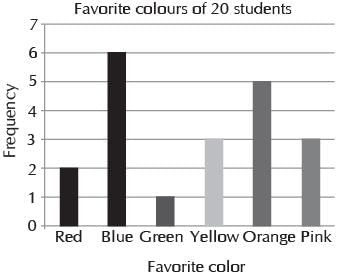
Q. ​How many more of them favored orange than those who favored green?

Detailed Solution for Olympiad Test : Pictorial Representation Of Data - Question 2

5 of them favored orange and 1 only favored green. 5 − 1 = 4 Therefore 4 more favored orange than those who favored green.

1 Crore+ students have signed up on EduRev. Have you? Download the App
Olympiad Test : Pictorial Representation Of Data - Question 3

The bar graph shows the scores obtained by Shraddha in her end of year exams.
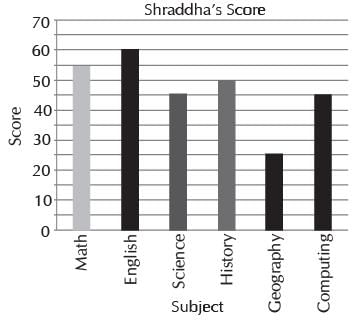

Q. How many more did Shraddha score in her best subject than in her worst subject?

Detailed Solution for Olympiad Test : Pictorial Representation Of Data - Question 3

Shraddha’s best subject was English, where she scored 60. Shraddha’s worst subject was Geography, where she scored 25. Therefore she scored (60 – 25) = 35 more in her best subject than in her worst subject.

Olympiad Test : Pictorial Representation Of Data - Question 4

The bar graph shows the scores obtained by Shraddha in her end of year exams.
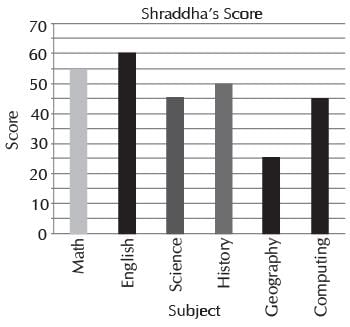
​Q. Shubhra’s score in English was 15% higher than Shraddha’s score in English. What was Shubhra’s score in English?

Detailed Solution for Olympiad Test : Pictorial Representation Of Data - Question 4

The top of the English column on the graph is mapped to the point 60 on the vertical axis.  So, Shraddha’s score for English was 60. Then, we must add 15% of 60 to 60 to get the Shubhra’s score for English. 60 + (15%) (60)
= 60 + 9 = 69.

Olympiad Test : Pictorial Representation Of Data - Question 5

The pie chart shows the amount of time each day that Shraddha spends on various activities.
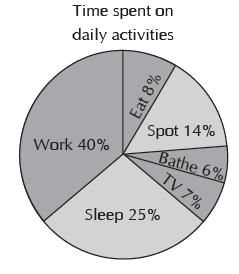
Q. ​If this information were displayed using a bar graph with hours on the vertical axis, what would be the height of the bar for sleep?

Detailed Solution for Olympiad Test : Pictorial Representation Of Data - Question 5

Sleep represents 25% of Shraddha’s day. 25% of 24 hours
= ¼ × 24 hours
= 6 hours.
So the height of the bar for sleep would be 6 hours.

Olympiad Test : Pictorial Representation Of Data - Question 6

Shraddha recorded the amount of time she spent on six activities over a twenty four hour period and drew a bar graph, as follows:
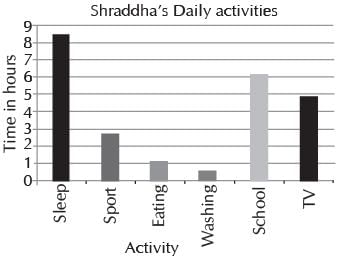
​Q. Approximately how many more hours did she spend sleeping than watching TV?

Detailed Solution for Olympiad Test : Pictorial Representation Of Data - Question 6

She spent about 8.5 hours sleeping and about 4.9 hours watching TV.

That’s about 3½ hours longer.

Olympiad Test : Pictorial Representation Of Data - Question 7

Shraddha recorded the temperature in her room (in Degrees Fahrenheit) every two hours over a 12 hour period from noon to midnight. The results are shown in the line graph.
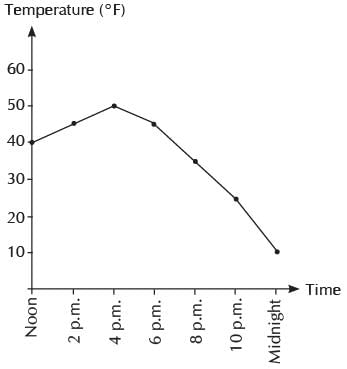
Q. What was the approximate temperature in her room at 9 p.m.?

Detailed Solution for Olympiad Test : Pictorial Representation Of Data - Question 7

B is the correct answer. The recorded temperature at 8 p.m. was 35°F. The recorded temperature at 10 p.m. was 25°F. The temperature was dropping at a regular rate. Therefore at 9 p.m. the temperature was about 30°F.

Olympiad Test : Pictorial Representation Of Data - Question 8

​The line graph shows how the record time for the 100 m sprint changed from 1964 when Bob Hayes of the US held the record to 2012 when Usain Bolt of Jamaica held the record.
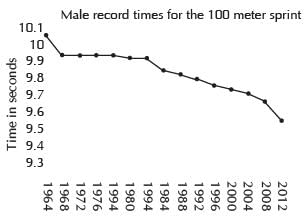
Q. From the graph, what was the maximum length of time for which the record remained unchanged?

Detailed Solution for Olympiad Test : Pictorial Representation Of Data - Question 8

From the information shown in the graph, the record remained unchanged from 1968 to 1980 - a 12 year period. (In fact it remained unchanged for nearly 15 years from October 1968 to July 1983)

Olympiad Test : Pictorial Representation Of Data - Question 9

The histogram shows the heights of 21 students in a class, grouped into 5-inch groups.
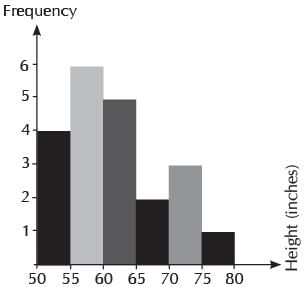

Q. How many students were greater than or equal to 60 inches tall?

Detailed Solution for Olympiad Test : Pictorial Representation Of Data - Question 9

The number of students greater than or equal to 60 inches tall are shown in the bars representing the groups 60 - 65, 65 - 70, 70 - 75 and 75 - 80
= 5 + 2 + 3 + 1
= 11

Olympiad Test : Pictorial Representation Of Data - Question 10

​The histogram shows the heights of 21 students in a class, grouped into 5 inches groups.
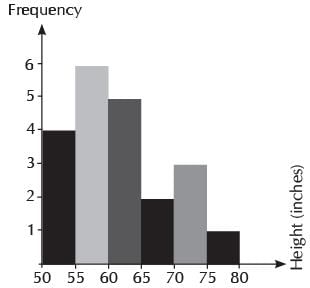
Q. How many students were greater than or equal to 55 inches tall but less than 70 inches tall?

Detailed Solution for Olympiad Test : Pictorial Representation Of Data - Question 10

The number of students that were greater than or equal to 55 inches tall but less than 70 inches tall are shown in the bars representing the groups 55 - 60, 60 - 65 and 65 - 70
= 6 + 5 + 2
= 13

Olympiad Test : Pictorial Representation Of Data - Question 11

A class carried out an experiment to measure the lengths of cuckoo eggs. The length of each egg was measured to the nearest mm. The results are shown in th95e5 2f0ollowing histogram:
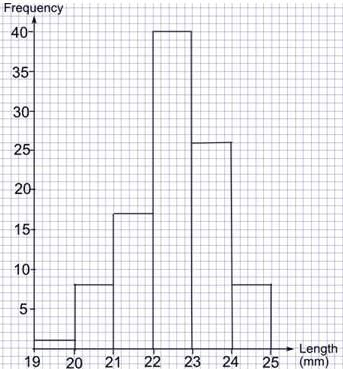
Q. How many eggs were measured altogether in the experiment?

Detailed Solution for Olympiad Test : Pictorial Representation Of Data - Question 11

The number of eggs measured is found by adding the frequencies
= 1 + 8 + 17 + 40 + 26 + 8
= 100

Olympiad Test : Pictorial Representation Of Data - Question 12

The histogram shows the birth weights of 100 new born babies. Babies who weigh less than 5 lb are considered to have a low birth weight. Babies who weigh 10 lb or more are considered to have a high birth weight.
[image]
Q. What percent of the babies had neither a low nor a high birth weight?

Detailed Solution for Olympiad Test : Pictorial Representation Of Data - Question 12

Given histogram shows the birth weights of 100 newborn babies.

From the graph, babies who weigh more than 5lb and less than 10lb are 8 + 15 + 30 + 22 + 16 = 91.
Therefore, the percent of the babies who had neither a low or a high birth weight is  91/100 × 100 = 91%

Olympiad Test : Pictorial Representation Of Data - Question 13

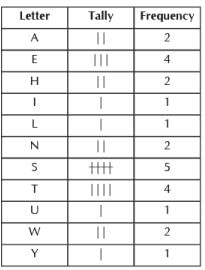
Which letter occurs the most frequently in the following sentence?
THE SUN ALWAYS SETS IN THE WEST.

Detailed Solution for Olympiad Test : Pictorial Representation Of Data - Question 13

B is the correct answer. Construct a Frequency Distribution table as follow:

The letter that occurs the most frequently is S.

Olympiad Test : Pictorial Representation Of Data - Question 14

​A fair die was thrown 100 times. The frequency distribution is shown in the following table: 
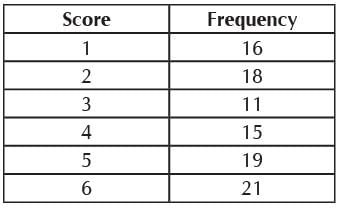
Q. How many throws scored less than 3?

Detailed Solution for Olympiad Test : Pictorial Representation Of Data - Question 14

The correct answer is B. Scores less than 3 means 1 or 2, and does not include 3 itself. There were 16 1’s and 18 2’s, so 34 altogether less than 3.

Olympiad Test : Pictorial Representation Of Data - Question 15

60 students sat a test. The frequency distribution is shown in the following table:
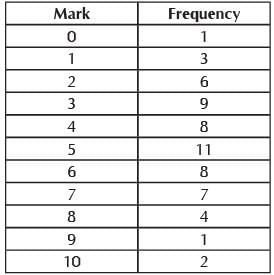
Q. How many students scored 5 or more?

Detailed Solution for Olympiad Test : Pictorial Representation Of Data - Question 15

The correct answer is B. Scores less than 3 means 1 or 2, and does not include 3 itself. There were 16 1’s and 18 2’s, so 34 altogether less than 3.

Olympiad Test : Pictorial Representation Of Data - Question 16

60 students sat a test. The frequency distribution is shown in the following table:
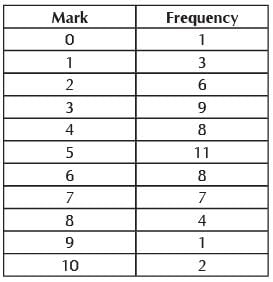
Q. ​How many students scored greater than or equal to 4, but less than or equal to 7?

Detailed Solution for Olympiad Test : Pictorial Representation Of Data - Question 16

The right answer is D. Greater than or equal to 4, but less than or equal to 7 includes 4, 5, 6 and 7.
8 students scored 4
11 students scored 5
8 students scored 6
7 students scored 7
So 8 + 11 + 8 + 7 = 34 scored greater than or equal to 4, but less than or equal to 7.

Olympiad Test : Pictorial Representation Of Data - Question 17

Shraddha did a survey of the number of pets owned by her classmates, with the following results:
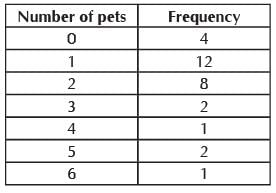
Q. ​How many of her classmates had less than 3 pets?

Detailed Solution for Olympiad Test : Pictorial Representation Of Data - Question 17

The right answer is C.  Less than 3 includes 0, 1 and 2, but does not include 3.
4 classmates had 0 pets
12 classmates had 1 pet
8 classmates had 2 pets
So, 4 + 12 + 8 = 24 had less than 3 pets.

Olympiad Test : Pictorial Representation Of Data - Question 18

​The children in a class did a survey of the number of siblings (brothers and sisters) each of them had. The results are recorded in the following table:
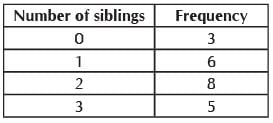
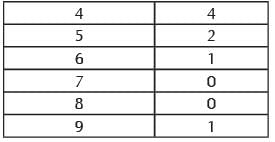
Q. How many families had more than 4 children?

Detailed Solution for Olympiad Test : Pictorial Representation Of Data - Question 18

C is the correct answer. There is a trick to this question. The table shows the number of siblings (brother and sister) each child has. The question asks how many children in the family ... which also includes the child being surveyed. So if a child has 3 siblings, then the family has 4 children!
So to find How many families had more than 4 children, we must include those children with 4, 5, 6, 7, 8 and 9 siblings:
4 of them had 4 siblings
2 of them had 5 siblings
1 of them had 6 siblings
0 of them had 7 siblings
0 of them had 8 siblings
1 of them had 9 siblings
So 4 + 2 + 1 + 0 + 0 + 1 = 8 of them came from families with more than 4 children.

Olympiad Test : Pictorial Representation Of Data - Question 19

Which one of the following is discrete data? 

Detailed Solution for Olympiad Test : Pictorial Representation Of Data - Question 19

B is discrete because the numbers of brothers and sisters can only be values like 0, 1, 2 etc. The other three are all continuous because they can take any value within a range, such as 160.3 cm or 75.35 kg.

Olympiad Test : Pictorial Representation Of Data - Question 20

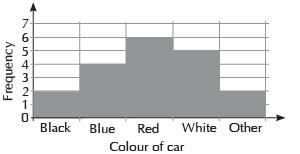
​Lisa conducted a survey of the cars passing her house. How many cars passed in total?
Detailed Solution for Olympiad Test : Pictorial Representation Of Data - Question 20

B Total cars 2 + 4 + 6 + 5 + 2 = 19

Information about Olympiad Test : Pictorial Representation Of Data Page
In this test you can find the Exam questions for Olympiad Test : Pictorial Representation Of Data solved & explained in the simplest way possible. Besides giving Questions and answers for Olympiad Test : Pictorial Representation Of Data , EduRev gives you an ample number of Online tests for practice

Top Courses for Class 5

Download as PDF

Top Courses for Class 5