Quant Mock Test - 17 - CLAT MCQ
15 Questions MCQ Test - Quant Mock Test - 17

Directions: Study the following graph carefully to answer the questions that follow.
Average monthly expenditure of an organisation under various Heads Total Expenditure Rs. 18, 50, 000

Q. What is the amount spent on transport subsidy and canteen subsidy together?
Average monthly expenditure of an organisation under various Heads Total Expenditure Rs. 18, 50, 000
Directions: Study the following graph carefully to answer the questions that follow.
Average monthly expenditure of an organisation under various Heads Total Expenditure Rs. 18, 50, 000

Q. What is the difference between the expenditure on salary to staff and that on loans to staff?
Average monthly expenditure of an organisation under various Heads Total Expenditure Rs. 18, 50, 000

Directions: Study the following graph carefully to answer the questions that follow.
Average monthly expenditure of an organisation under various Heads Total Expenditure Rs. 18, 50, 000

Q. The amount spent on medical to staff is what percent of the amount spent on salary?
Average monthly expenditure of an organisation under various Heads Total Expenditure Rs. 18, 50, 000
Directions: Study the following graph carefully to answer the questions that follow.
Average monthly expenditure of an organisation under various Heads Total Expenditure Rs. 18, 50, 000

Q. What is the amount spent on telephone?
Directions: Study the following graph carefully to answer the questions that follow.
Average monthly expenditure of an organisation under various Heads Total Expenditure Rs. 18, 50, 000
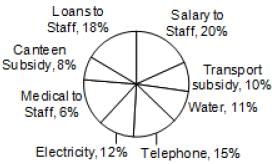
Q. What is the total expenditure on electricity and water together?
Directions: Show below is the multiple bar diagram depicting the changes in the student’s strength of a college in four faculties from 2000-01 to 2002-03.
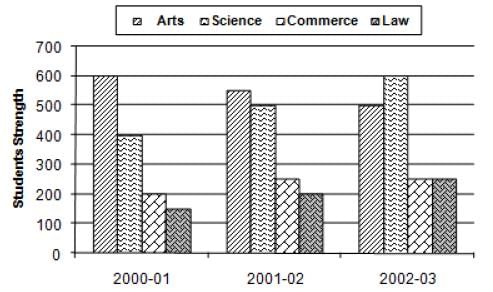
Study the above multiple bar chart and mark a tick against the correct answer in each of the following questions.
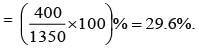
Q. The percentage of students in science faculty in 2000-01 was:
Directions: Show below is the multiple bar diagram depicting the changes in the student’s strength of a college in four faculties from 2000-01 to 2002-03.

Study the above multiple bar chart and mark a tick against the correct answer in each of the following questions.
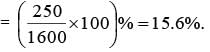
Q. The percentage of students in law faculty in 2002-03 was:
Directions: Show below is the multiple bar diagram depicting the changes in the student’s strength of a college in four faculties from 2000-01 to 2002-03.

Study the above multiple bar chart and mark a tick against the correct answer in each of the following questions.
Q. How many times the total strength was of the strength of commerce students in 2001-02?
Directions: Show below is the multiple bar diagram depicting the changes in the student’s strength of a college in four faculties from 2000-01 to 2002-03.

Study the above multiple bar chart and mark a tick against the correct answer in each of the following questions.
Q. During which year the strength of arts faculty was minimum?
Directions: Show below is the multiple bar diagram depicting the changes in the student’s strength of a college in four faculties from 2000-01 to 2002-03.

Study the above multiple bar chart and mark a tick against the correct answer in each of the following questions.
Q. How much per cent was the increase in science students in 2002-03 over 2000-01?
Directions: In the following graph, students passing in five years 2001 to 2005 from two schools A and B are given. On the basis of this graph, answer the following questions.

Q. What is the total no. of students passed from both schools during 2002 to 2004?
Directions: In the following graph, students passing in five years 2001 to 2005 from two schools A and B are given. On the basis of this graph, answer the following questions.

Q. The ratio of students passed from school A and those from school B in the years 2003 and 2005 together is
Directions: In the following graph, students passing in five years 2001 to 2005 from two schools A and B are given. On the basis of this graph, answer the following questions.
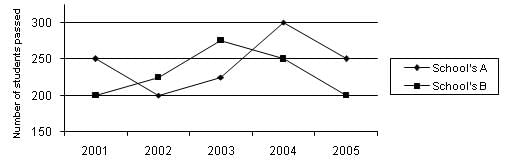
Q. The average of students passed from school B during 2002 to 2004 is
Directions: In the following graph, students passing in five years 2001 to 2005 from two schools A and B are given. On the basis of this graph, answer the following questions.
Q. The total no. of students passed from both the schools during the whole period of 2001to 2005 is
Directions: In the following graph, students passing in five years 2001 to 2005 from two schools A and B are given. On the basis of this graph, answer the following questions.
Q. Find the ratio of the maximum number of students passed in any year during the whole period 2001 to 2005 form school ‘A’ to that from school ‘B’.
Important Questions for Quant Mock Test - 17
Quant Mock Test - 17 MCQs with Answers
Online Tests for Quant Mock Test - 17
|
© EduRev
|
Education Revolution
|


|


within 7 days!