Practice Test: Pie Chart - 2 - Civil Engineering (CE) MCQ
10 Questions MCQ Test - Practice Test: Pie Chart - 2

Instructions
Chart 1 shows the distribution by value of top 6 suppliers of MFA Textiles in 1995. Chart 2 shows the distribution by quantity of top 6 suppliers of MFA Textiles in 1995. The total value is 5760 million Euro (European currency). The total quantity is 1.055 million tonnes.

Q. The country which has the highest average price is
Instructions
Chart 1 shows the distribution by value of top 6 suppliers of MFA Textiles in 1995. Chart 2 shows the distribution by quantity of top 6 suppliers of MFA Textiles in 1995. The total value is 5760 million Euro (European currency). The total quantity is 1.055 million tonnes.
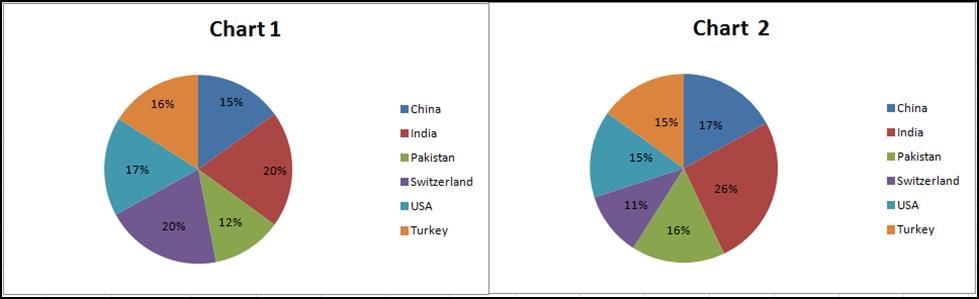
Q. The average price in Euro per kilogram for Turkey is roughly

Instructions:
For the following three questions: Answer the questions based on the pie charts given below. Chart 1 shows the distribution of 12 million tonnes of crude oil transported through different modes over a specific period of time. Chart 2 shows the distribution of the cost of transporting this crude oil. The total cost was Rs. 30 million.

Q. The cost in rupees per tonne of oil moved by rail and road happens to be roughly
For the following three questions: Answer the questions based on the pie charts given below. Chart 1 shows the distribution of 12 million tonnes of crude oil transported through different modes over a specific period of time. Chart 2 shows the distribution of the cost of transporting this crude oil. The total cost was Rs. 30 million.
Instructions:
For the following three questions: Answer the questions based on the pie charts given below. Chart 1 shows the distribution of 12 million tonnes of crude oil transported through different modes over a specific period of time. Chart 2 shows the distribution of the cost of transporting this crude oil. The total cost was Rs. 30 million.
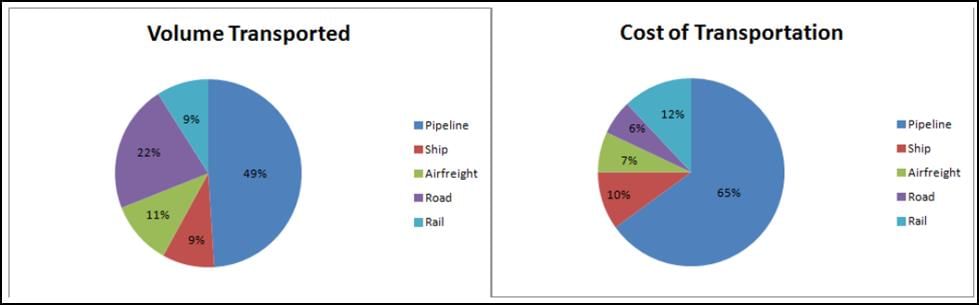
Q. From the charts given, it appears that the cheapest mode of transport is
Instructions:
For the following three questions: Answer the questions based on the pie charts given below. Chart 1 shows the distribution of 12 million tonnes of crude oil transported through different modes over a specific period of time. Chart 2 shows the distribution of the cost of transporting this crude oil. The total cost was Rs. 30 million.

Q. If the costs per tonne of transport by ship, air and road are represented by P, Q and R respectively, which of the following is true?
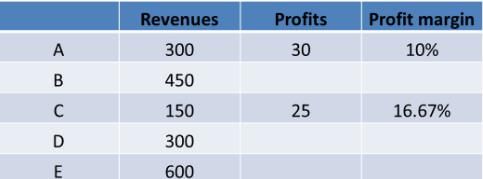
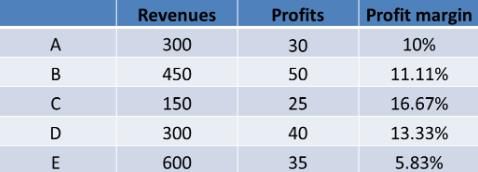
Total revenues are Rs. 1800 crores. Overall profit margin is 10%. The division with the largest revenue has the least profit margin but not the least profits. The division with the profit margin higher than all others generates the least profit. Exactly one division has the same profit margin as the overall Company. Company D generates more profits than Company E.

Q. How much profit did Company A make?
Total revenues are Rs. 1800 crores. Overall profit margin is 10%. The division with the largest revenue has the least profit margin but not the least profits. The division with the profit margin higher than all others generates the least profit. Exactly one division has the same profit margin as the overall Company. Company D generates more profits than Company E.
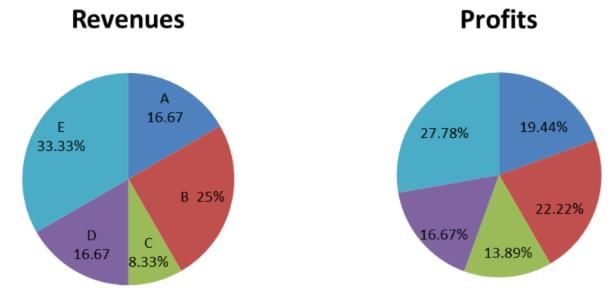
Q. What was the profit margin for company B?
Total revenues are Rs. 1800 crores. Overall profit margin is 10%. The division with the largest revenue has the least profit margin but not the least profits. The division with the profit margin higher than all others generates the least profit. Exactly one division has the same profit margin as the overall Company. Company D generates more profits than Company E.

Q. How much profit did company E make?
The following pie-chart shows the percentage distribution of the expenditure incurred in publishing a book. Study the pie-chart and the answer the questions based on it.
Various Expenditures (in percentage) Incurred in Publishing a Book
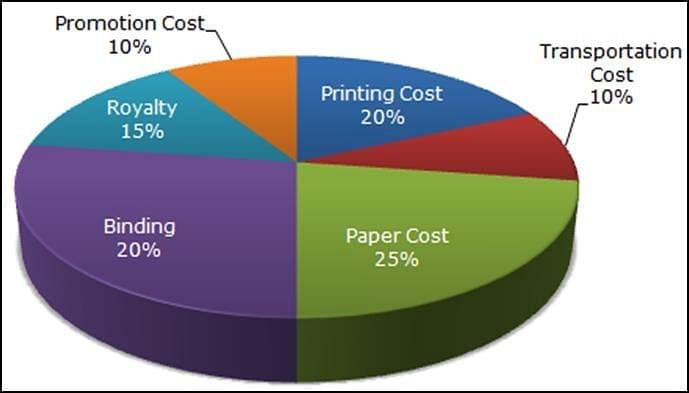
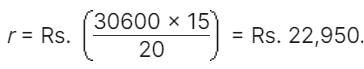
Q. If for a certain quantity of books, the publisher has to pay Rs. 30,600 as printing cost, then what will be amount of royalty to be paid for these books?
The following pie-chart shows the percentage distribution of the expenditure incurred in publishing a book. Study the pie-chart and the answer the questions based on it.
Various Expenditures (in percentage) Incurred in Publishing a Book

Q. The price of the book is marked 20% above the C.P. If the marked price of the book is Rs. 180, then what is the cost of the paper used in a single copy of the book?

Important Questions for Practice Test: Pie Chart - 2
Practice Test: Pie Chart - 2 MCQs with Answers
Online Tests for Practice Test: Pie Chart - 2
|
© EduRev
|
Education Revolution
|


|


within 7 days!