Mechanical Engineering Exam  >  Mechanical Engineering Tests  >  Test: Forecasting Level - 1 - Mechanical Engineering MCQ

Test: Forecasting Level - 1 - Mechanical Engineering MCQ


Test Description

20 Questions MCQ Test - Test: Forecasting Level - 1

Test: Forecasting Level - 1 for Mechanical Engineering 2024 is part of Mechanical Engineering preparation. The Test: Forecasting Level - 1 questions and answers have been prepared according to the Mechanical Engineering exam syllabus.The Test: Forecasting Level - 1 MCQs are made for Mechanical Engineering 2024 Exam. Find important definitions, questions, notes, meanings, examples, exercises, MCQs and online tests for Test: Forecasting Level - 1 below.
Solutions of Test: Forecasting Level - 1 questions in English are available as part of our course for Mechanical Engineering & Test: Forecasting Level - 1 solutions in Hindi for Mechanical Engineering course. Download more important topics, notes, lectures and mock test series for Mechanical Engineering Exam by signing up for free. Attempt Test: Forecasting Level - 1 | 20 questions in 25 minutes | Mock test for Mechanical Engineering preparation | Free important questions MCQ to study for Mechanical Engineering Exam | Download free PDF with solutions
Test: Forecasting Level - 1 - Question 1

Which one of the following is not a technique of Long Range Forecasting?

Detailed Solution for Test: Forecasting Level - 1 - Question 1
Correlation and Regression method is used for short and medium range forecasting.

Test: Forecasting Level - 1 - Question 2

Which one of the following forecasting techniques is most suitable for making long range forecasts?

1 Crore+ students have signed up on EduRev. Have you? Download the App
Test: Forecasting Level - 1 - Question 3

Which one of the following is a qualitative technique of demand forecasting?

Test: Forecasting Level - 1 - Question 4

For sales forecasting, pooling of expert opinions is made use of in

Test: Forecasting Level - 1 - Question 5

In an n-month moving average methods for stable demand, the ‘n’ value in a simple moving average method should be

Detailed Solution for Test: Forecasting Level - 1 - Question 5

Choosing the 'n' Value in a Simple Moving Average Method for Stable Demand

- When utilizing a simple moving average method to forecast demand or trends, especially in scenarios where the demand is stable, the selection of the 'n' value, which represents the number of periods to be averaged, is crucial. The correct choice of 'n' influences the smoothness of the resulting moving average and how well it can indicate underlying trends without being overly sensitive to short-term fluctuations.

- Why a Higher 'n' Value is Recommended for Stable Demand:

- Smoothens Random Fluctuations: A higher 'n' value averages out data over a longer period, which effectively smoothens out random fluctuations and noise in the data. This is particularly beneficial in stable demand scenarios where you're interested in identifying the long-term trend rather than reacting to short-term variations.

- Provides a More Stable Trend Line: In environments where demand is generally stable, a higher 'n' value yields a moving average that is less reactive to minor changes. This results in a trend line that more accurately reflects the stable nature of the demand, making it easier for businesses to plan and make decisions.

- Reduces the Impact of Anomalies: Using a higher 'n' value dilutes the impact of any anomalous or outlier data points, which might otherwise skew the analysis and lead to incorrect interpretations or predictions.

- Better for Long-term Planning: For businesses or analyses focused on long-term planning and forecasting, a higher 'n' value in a simple moving average method provides a forecast that aligns better with these goals by highlighting more enduring trends rather than ephemeral changes.

- Considerations:

- While a higher 'n' value is generally beneficial in stable demand scenarios, it's important to note that too high a value can make the moving average too insensitive to genuine changes in the trend. Therefore, the specific choice of 'n' should be based on the industry, the typical cycle lengths observed in the demand, and the strategic focus of the forecasting effort (short-term vs. long-term).

- Additionally, the choice of 'n' might need to be adjusted as more data becomes available or if the nature of the demand changes (e.g., if the market becomes more volatile).

*Answer can only contain numeric values
Test: Forecasting Level - 1 - Question 6

The actual demand values for 4 months is known. To calculate the forecasted demand value for 5th month using 4 month moving average method, what will be the weightage given to demand values?


Detailed Solution for Test: Forecasting Level - 1 - Question 6

Test: Forecasting Level - 1 - Question 7

In exponential smoothening method the weights are in

Test: Forecasting Level - 1 - Question 8

Which of the following is not a weighted average method?

Test: Forecasting Level - 1 - Question 9

Which one of the following methods can be used for forecasting when a demand pattern is consistently increasing or decreasing?

Detailed Solution for Test: Forecasting Level - 1 - Question 9

Regression analysis is a powerful method for forecasting when a demand pattern is consistently increasing or decreasing. By analyzing historical data and identifying the underlying trend, regression analysis can provide more accurate and robust forecasts compared to simpler methods. It is important to properly implement and interpret regression analysis to ensure reliable forecasts for future demand levels.

Test: Forecasting Level - 1 - Question 10

Which of the following represents forecasting errors?

1. Mean forecast error

2. Mean absolute deviation

3. Tracking signal

*Answer can only contain numeric values
Test: Forecasting Level - 1 - Question 11

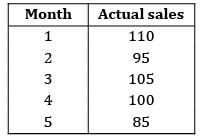
Consider the given sales data

The forecast weights are given as 40%, 30%, 20% and 10%. Find the forecasted value for the month of 6 using 4 month weighted moving average method.


Detailed Solution for Test: Forecasting Level - 1 - Question 11

= 94.5

Test: Forecasting Level - 1 - Question 12

Using the exponential smoothing method of forecasting, what will be the forecast for the fourth week if the actual and forecasted demand for the third week is 480 and 500 respectively and α = 0.2?

Detailed Solution for Test: Forecasting Level - 1 - Question 12

F4 = αd3 + (1 − α)F3

F3 = (0.2)(480) + (0.8)500

= 96 + 400 = 496

Test: Forecasting Level - 1 - Question 13

The demand for a product in the month of March turned out to be 20 units against an earlier made forecast of 20 units. The actual demand for April and May turned to be 25 and 26 units respectively. What will be the forecast for the month of June, using exponential smoothing method and taking smoothing constant α as 0.2?

Detailed Solution for Test: Forecasting Level - 1 - Question 13

α = 0.2, DMarch = 20 units DApril = 25 DMay = 26

FMar = 20 units FApril = 20 FMay = 21 FJun =?

FApril = α × DMar + (1 − α) FMar = 0.2 × 20 + 0.8 × 20 = 20

FMay = α × DApril + (1 − α) × FApril = 0.2 × 25 + 0.8 × 20 = 21

FJune = α × DMay + (1 − α) × FMay

FMay = 0.2 × 26 + 0.8 × 21 = 22 units

Test: Forecasting Level - 1 - Question 14

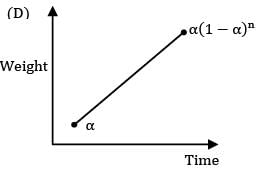
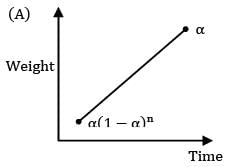
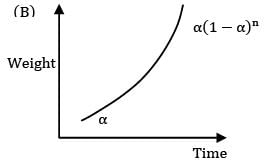
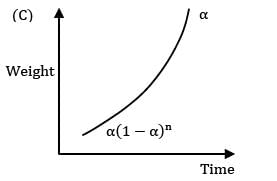
Which of the following curve represents variation of weights with respect to time for exponential smoothening method?
Test: Forecasting Level - 1 - Question 15

For stable demand the value of α should be

Detailed Solution for Test: Forecasting Level - 1 - Question 15

For stable demand ‘n’ value should be more

⇒ α will be less.

Test: Forecasting Level - 1 - Question 16

The sale of cars in a shop for four years is given as 102, 98, 108, 115. The sales follow exponentially smoothening average method with a smoothing factor of 0.2. The number of sales in the subsequent month will be (approximately):

Detailed Solution for Test: Forecasting Level - 1 - Question 16

Ft+1 = αDt + α(1 − α)Dt−1 + α(1 − α)2Dt−2+ α(1 − α)3Dt−3

= 0.2(115) + 0.2(1 − 0.2) × 108

+ 0.2(1 − 0.2)2 × 98

+ 0.2(1 − 0.2)3 × 102

= 63.26

*Answer can only contain numeric values
Test: Forecasting Level - 1 - Question 17

The actual demand for a product from January to June is known. The actual demand and forecasted demand for the month of June is 90 and 80. Find the forecasted demand for the month of July.


Detailed Solution for Test: Forecasting Level - 1 - Question 17

Ft+1 = Ft + α(Dt − Ft )

FJuly = FJune + α(DJune − FJune )

FJuly = 80 + 0.28(90 − 80)

= 82.8

Test: Forecasting Level - 1 - Question 18

Which of the following forecast error is not used widely because of null effect?

Test: Forecasting Level - 1 - Question 19

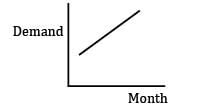
Which of the following method can be used for the following demand data?

Detailed Solution for Test: Forecasting Level - 1 - Question 19

The demand is having an increasing pattern. So use regression analysis

Test: Forecasting Level - 1 - Question 20

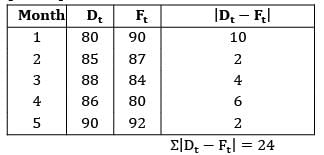
Consider the following demand data values

The mean absolute deviation is

Detailed Solution for Test: Forecasting Level - 1 - Question 20

Information about Test: Forecasting Level - 1 Page
In this test you can find the Exam questions for Test: Forecasting Level - 1 solved & explained in the simplest way possible. Besides giving Questions and answers for Test: Forecasting Level - 1, EduRev gives you an ample number of Online tests for practice

Top Courses for Mechanical Engineering

Download as PDF

Top Courses for Mechanical Engineering