Practice Test: Table Charts - 1 - CAT MCQ
10 Questions MCQ Test - Practice Test: Table Charts - 1

Directions: Read the table given below and answer the questions accordingly.
Shares traded in Chandigarh, Punjab, Haryana (In Rupees)

Q. The average for the high rates of Chandigarh for all the companies was
Directions: Read the table given below and answer the questions accordingly.
Shares traded in Chandigarh, Punjab, Haryana (In Rupees)

Q. Total of low value of the Punjab region exceeds the total of the low value of the region of Haryana by how much?

Directions: Read the table given below and answer the questions accordingly.
Shares traded in Chandigarh, Punjab, Haryana (In Rupees)
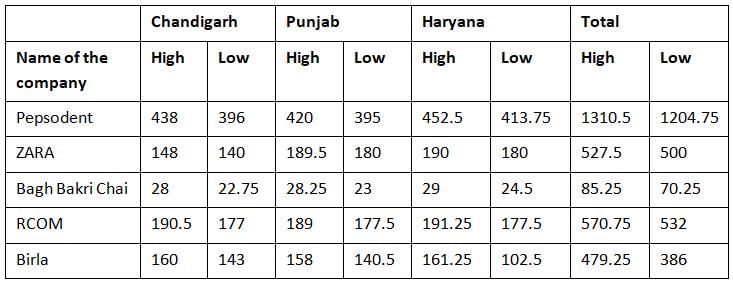
Q. Low for RCOM for all the given states/UT form what percent of the low for ZARA for the same?
Directions: Read the table given below and answer the questions accordingly.
Shares traded in Chandigarh, Punjab, Haryana (In Rupees)

Q. High for Chandigarh for BIRLA form what percent of the High for BIRLA for Punjab and Haryana combined?
Directions: Read the table given below and answer the questions accordingly.
Shares traded in Chandigarh, Punjab, Haryana (In Rupees)

Q. Total of high for all the companies in all the States/UT are more than the lows for all the states/UT by how much?
Directions: Study the following graph carefully and answer the questions given below:
Production (in Lakhs) of Widgets & Percentage defect over the years in five factories A, B, C, D, E.
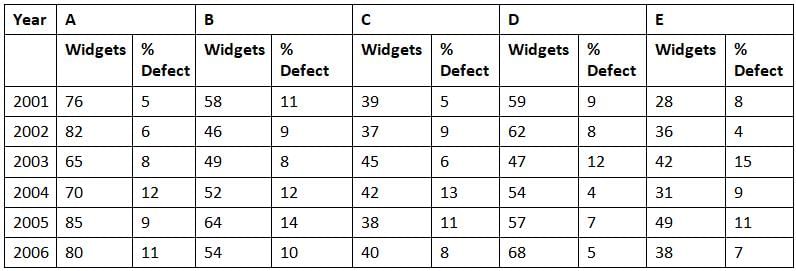
Q. The average production for the given data will be maximum for which factory?
Directions: Study the following graph carefully and answer the questions given below:
Production (in Lakhs) of Widgets & Percentage defect over the years in five factories A, B, C, D, E.

Q. What was the difference in defected widgets of factory C for the year 2006 and defected widgets of factory E for the year 2003?
Directions: Study the following graph carefully and answer the questions given below:
Production (in Lakhs) of Widgets & Percentage defect over the years in five factories A, B, C, D, E.
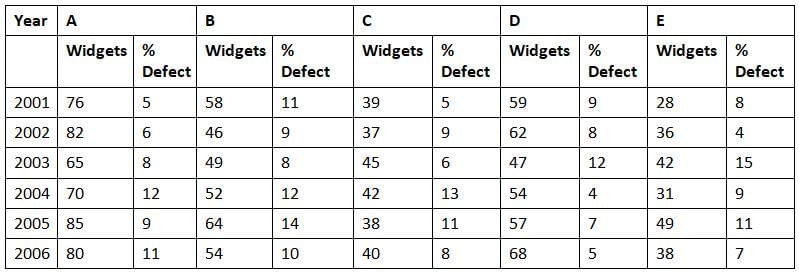
Q. The average number of widgets that were produced in the year 2002 formed what percent of the widgets that were produced in the year 2006?
Directions: Study the following graph carefully and answer the questions given below:
Production (in Lakhs) of Widgets & Percentage defect over the years in five factories A, B, C, D, E.
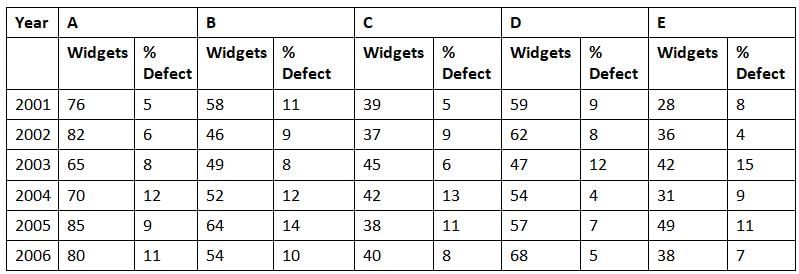
Q.What was the difference in the number of widgets of factory C which were free from any defect in the years 2004 and 2006?
Directions: Study the following table carefully and answer the questions given below.
Number of candidates appeared (App.) and percentage of candidates qualified (Qual.) under different disciplines over the years.
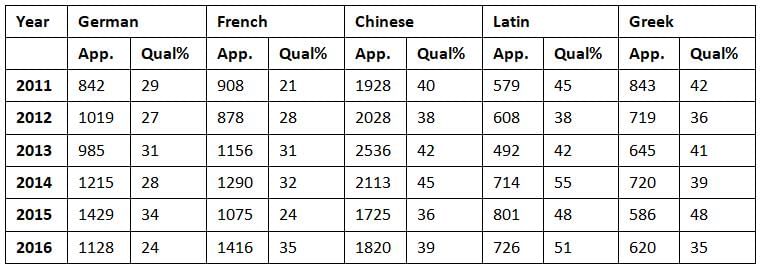
Q. Approximately, what was the percentage increase in the number of candidates who appeared under the German stream from 2013 to 2014(approx)?
Important Questions for Practice Test: Table Charts - 1
Practice Test: Table Charts - 1 MCQs with Answers
Online Tests for Practice Test: Table Charts - 1
|
© EduRev
|
Education Revolution
|


|


within 7 days!